Showing posts with label SCSM. Show all posts

Thursday, March 14, 2019

System Center 2019 is now Generally Available!

Following on from last weeks post, Microsoft has just announced the General Availability release of System Center 2019.


This release is part of the long term servicing channel (LTSC) license model and comes with a support bandwidth of 10 years.

With full support for Windows Server 2019 across the stack, here's some of the additional capabilities that you get with System Center 2019:
  • VMM integration with Azure Update Management for simplified patching of virtual machines.
  • Better SCOM integration with Azure services such as Service Map to create automatic Distributed Application models based on server dependencies.
  • Azure Management Pack brings comprehensive alert and performance metrics from Azure resources into SCOM.
  • Along with a modernized and extensible SCOM full HTML web console, subscriptions and notifications are now modernized with support for HTML based email.
  • Maintenance schedules in SCOM with SQL server AlwaysOn are now supported.
  • SCOM Update and Recommendations feature for Linux workloads enables discovery of up-to-date MPs for Linux environments.
  • Linux monitoring is now resilient to SCOM management server failover.
  • All Windows Server Management Packs now support Windows Server 2019.
  • Dynamic Storage Optimization in VMM enables higher availability of workloads.
  • VMM now provides health and operational status of storage disks in Hyper Converged as well as disaggregated deployment.
  • New RBAC role in VMM ensures that IT admins can be provided access commensurate with their role and no more.
  • Support for latest versions of VMware in VMM (to enable migration to Hyper-V).
  • Faster backups with DPM with a 75% increase in speed and a monitoring experience for key backup parameters via Log Analytics.
  • DPM further supports backup of VMWare VMs including to tape.
  • Orchestrator supports PowerShellv4+.
  • Service Manager has an enhanced Active Directory connector.
  • Support for service logon across the System Center suite aligning with security best practice.
You can get your hands on this latest release from all of the normal download channels including Volume Licensing Center, my.visualstudio.com and also the Microsoft Evaluation Center.


Enjoy!

Thursday, April 26, 2018

SCOM 2016 Update Rollup 5 is Now Available

A couple of days ago, Microsoft announced the latest Update Rollup (UR5) for SCOM 2016.

The Fixes

Unlike the last UR4 release, this update comes with a raft of new bug fixes - including a handy one for when you want to co-exist the SCOM and SCSM consoles on the same server along with a fix for a widely reported bug that occurs when performing an in-place upgrade of SCOM 2016 to the Semi-Annual Channel SCOM 1801.

Here's what you get with UR5:

  • The SCOM console and Service Manager console for PowerShell modules can now coexist on the same server. (Note Both SCOM Update Rollup 5 (this update) and Service Manager Update Rollup 5 (update KB 4093685) must be installed to resolve this issue.)
  • Active Directory Integration rules are not visible or editable in an upgraded 2016 Management Group. This prevents the ongoing management of Active Directory integration assignment in the upgraded Management Group.
  • When the UNIX host name on the server is in lowercase, the OS and MonitoredBy information is displayed incorrectly in the Unix/Linux Computers view.
  • Active Directory integrated agents do not display correct failover server information.
  • Performance views in the web console do not persist the selection of counters after web console restart or refresh.
  • The PowerShell cmdlet Get-SCXAgent fails with error “This cmdlet requires PowerShell version 3.0 or greater.”
  • During the upgrade from SCOM 2016 to SCOM 1801, if the reporting server is installed on a server other than the management server, the upgrade fails. Additionally, you receive the error message, "The management server to which this component reports has not been upgraded."
  • If a group name has been changed through the operations console, the Get-SCOMGroup cmdlet does not retrieve the group data that includes the changed group name.
  • Error HTTP 500 occurs when you access Diagram view through the web console.
  • When you download a Linux management pack after you upgrade to SCOM 2016, the error "OpsMgr Management Configuration Service failed to process configuration request (Xml configuration file or management pack request)" occurs.
  • The SQLCommand Timeout property is exposed so that it can be dynamically adjusted by users to manage random and expected influx of data scenarios.
  • The MonitoringHost process crashes and returns the exception "System.OverflowException: Value was either too large or too small for an Int32."
  • When company knowledge is edited by using the Japanese version of Microsoft Office through the SCOM console, the error (translated in English) "Failed to launch Microsoft Word. Please make sure Microsoft Word is installed. Here is the error message: Item with specified name does not exist" occurs.
  • Accessing Silverlight dashboards displays the "Web Console Configuration Required" message because of a certificate issue.
  • Microsoft.SystemCenter.ManagementPack.Recommendations causes errors to be logged on instances of Microsoft SQL Server that have case-sensitive collations.
  • Deep monitoring displays error “Discovery_Not_Found” if the installation of JBoss application server is customized.
  • Adds support for the Lancer driver on IBM Power 8 Servers that use AIX.
  • The ComputerOptInCompatibleMonitor monitor is disabled in the Microsoft.SystemCenter.Advisor.Internal management pack. This monitor is no longer valid.
My Advice

As always, my advice for deploying this update is to head over to Kevin Holman's blog and wait for his handy step-by-step guide to get this up and running in your non-production environments first.

Monday, July 13, 2015

Quickly Check Build Numbers for Common Microsoft Applications

If you ever have a problem trying to identify which version of your application its build number relates to, then I've got something pretty useful to help you out.


For the past year I've been referencing a community-authored blog that posts current build number references for common Microsoft applications and provides a download link to each cumulative update or service pack.

The list of applications that are referenced include System Center and SQL (definitely one you'll use a lot here). It's regularly updated (the new 2016 Tech Preview releases are all there) and goes back quite a few versions - MOM 2000 is even listed!

There's a handy navigation ribbon to choose your application or if you like, just use the tags.

Here's the blog URL:


Tuesday, August 19, 2014

Useful Recent CloudOS News and Blogs

Well, after a few weeks away from work on vacation, I've finally managed to filter through the majority of my unread emails and Twitter feeds. What I've come across from browsing through just a few short weeks of them is a number of very useful and cool updates and community offerings for System Center 2012 R2, Windows Azure Pack, Azure and Windows Server 2012 R2.

I've broken my favourites down into categories to make things easier to reference and if you haven't seen some of these posts yet and are working with CloudOS products, then I'd strongly advise you to check them out:

SCOM

Jalasoft – Xian SNMP Device Simulator V5


SCOM 2012 – Display & Download MPs Using PowerShell Widgets


VMM

Download the VMM Network Builder

Blog Series: Bare Metal Post-Deployment


So that's it in a nutshell for now - and although it's not a comprehensive list of everything that's been happening over the past month or so, there's still a lot of very impressive community content around CloudOS.

Enjoy!

Thursday, June 19, 2014

TechCamp 2014 Dublin

Day 1 for our TechCamp 2014 event has just finished and each session had a great turnout of attendees. Microsoft Ireland's Art Coughlan kicked off with a keynote speech on how Microsoft can help people with their journey to the cloud and he gave some great real-world examples of well known global brands using Cloud Technologies such as Azure, Hyper-V and System Center.

After the keynote this morning, Aidan Finn gave a really interesting session on Windows Server Storage Spaces and Scale Out File Servers. He walked through building the solutions in his demo step-by-step to give people an idea of how easy it is to get started.

After Aidan's presentation, it was my turn to get down and dirty and shake with datacentre automation in my 'Service Automation Using System Center' session. I first spoke about getting your automation processes properly mapped out and including the right teams to plan the process. Then I went into a demonstration that incorporated System Center Orchestrator, Service Manager and Windows Azure Pack. Thankfully my themed Windows Azure Pack Tenant Portal went down well and I received some nice attendee comments during lunch about it:


The 'New Hire Onboard' process that I automated was made possible using System Center Orchestrator and Service Manager integrated into Windows Azure Pack. The secret sauce to surface the request management in the WAP Tenant portal was delivered using the awesome new GridPro Request Management - check it out here: http://www.gridprosoftware.com/en/products/requestmanagement)


After lunch, Damian Flynn took to the stage and gave a full overview to the audience on how all the System Center components integrate with each other and then he went into the Windows Azure Pack Framework and all it's moving parts - a very enjoyable session for the attendees with the 'F Bombs' dropped kept to a minimum ;)

The final presentation of the day saw Aidan get back up for more heckling as he spoke about this time on Hybrid Cloud using Microsoft Azure. Some really interesting demo's delivered to the audience configuring public-cloud VM's and virtual networking on the fly.

That wraps up Day 1, tomorrow's track of 'Software as a Service' should be a blast!

Tuesday, February 18, 2014

System Center Service Manager (SCSM) is here to stay!

If you've been listening to the rumour mill over the past 12 months, then you might have heard some people state that System Center 2012 R2 - Service Manager has had its day and that it would be retired soon.

My good friend  and co-author on the Mastering Windows Server 2012 R2 book - Christian Booth (Microsoft) - has just written a blog post on the System Center Engineering Team blog that squashes those rumours. His post not only gives confidence to existing and potential customers over the viability of the product as we know it, but also mentions their plans to take it forward and make changes for the better to deliver a consistent and quality solution.

Check out the full post here:

System Center: Service Manager – A phoenix in its own right

This is great news for anyone working in the System Center space as it shows that instead of pumping all their investment and development resources into cloud-based solutions such as Azure, they are still more than focused on the on-premise System Center offerings that we all know so well!

Tuesday, July 5, 2011

SCOM Dashboards - Conclusion and References

Before reading this post, please ensure you have reviewed my previous posts on SCOM Dashboarding from the links below:

SCOM Dashboards - The Intro
SCOM Dashboards - Part 1 - Installing WSS 3.0
SCOM Dashboards - Part 2 - Installing the Dashboard Solution Accelerator
SCOM Dashboards - Part 3 - Customizing the Dashboard Banner and Logo
SCOM Dashboards - Part 4 - Customizing the Dashboard Tabs
SCOM Dashboards - Part 5 - Installing the Service Level Dashboard (SLD 2.0)
SCOM Dashboards - Part 6 - Adding SQL Queries to the Dashboards
SCOM Dashboards - Part 7 - The SCOM Distributed Application Health State Tab
SCOM Dashboards - Part 8 - Adding the SLD Tab to the SCOM Dashboard

I hope that if you are reading this post that it means you have taken the time to review the other posts in this series and have found the information in them useful. Although I haven't come across this solution on the web previously that offers a central tabbed dashboard that includes a SCOM Admin dashboard, a SCOM Distributed Application Health State dashboard and the SCOM Service Level Dashboard, it doesn't mean that I came up with the ideas for each component all by myself.

Below are some links to the other SCOM community member blog posts that made this particular series possible and I would like to thank them for their hard work and time put in to their posts as without them I wouldn't have been able to come up with this solution.


Kevin Holman (Credit for a huge amount of SQL queries and the best resource on the web for them)
http://blogs.technet.com/b/kevinholman/archive/2007/10/18/useful-operations-manager-2007-sql-queries.aspx

Cameron Fuller (Credit for SCSM dashboard customization)
http://blogs.catapultsystems.com/cfuller/archive/2010/12/11/using-the-service-manager-2010-dashboard-for-operations-manager.aspx

Tim McFadden (Credit for SCCM dashboard customization)
http://www.scom2k7.com/how-to-create-a-custom-scom-dashboard-to-show-key-management-group-information/

Steve Beaumont (Credit for Distributed Application Health State Dashboard)
http://systemscentre.blogspot.com/2011/04/system-center-dashboards-sccm-scom-sql.html

Anders Bengtsson (Credit for additional dashboard customization)
http://contoso.se/blog/?p=1409


Finally, the purpose of this blog series is to highlight the use of dashboard solutions for SCOM that are FREE and that haven't been blogged about much in the past. I have decided to omit the dashboard integration that can be used with Visio 2010 and Sharepoint 2010 as this has been blogged about all over the web and I didn't want to go over old ground again.

I have also omitted the excellent Savision LiveMaps dashboard solution as it is not free - contrary to what a lot of people think, Savision allow the use of 5 maps for free for 12 months, then you need to purchase a licence for them. If you do have the budget to spend and are looking for an extra dimension in SCOM dashboards, then Savision LiveMaps is the only way to go.

For more information on the Visio 2010, Sharepoint 2010 and Savision LiveMaps solutions, see the excellent blog series by SCOM MVP Marnix Wolf from the link below:

Marnix Wolf
http://thoughtsonopsmgr.blogspot.com/2010/09/scom-and-dashboards.html


That brings this series to an end, thanks for reading and hopefully you have found the information helpful.

SCOM Dashboards - Part 8 - Adding the SLD Tab to the SCOM Dashboard

Before reading this post, please ensure you have reviewed my previous posts on SCOM Dashboarding from the links below:

SCOM Dashboards - The Intro
SCOM Dashboards - Part 1 - Installing WSS 3.0
SCOM Dashboards - Part 2 - Installing the Dashboard Solution Accelerator
SCOM Dashboards - Part 3 - Customizing the Dashboard Banner and Logo
SCOM Dashboards - Part 4 - Customizing the Dashboard Tabs
SCOM Dashboards - Part 5 - Installing the Service Level Dashboard (SLD 2.0)
SCOM Dashboards - Part 6 - Adding SQL Queries to the Dashboards
SCOM Dashboards - Part 7 - The SCOM Distributed Application Health State Tab

The final piece of this jigsaw is to add the Service Level Dashboard Web Page as an active tab alongside the SCOM Dashboard and SCOM Distributed Applications Health State tabs

Open the SCOM Dashboard home page and click on 'Site Actions' on the left hand side, then select 'Site Settings' from the drop down menu


Now click on the 'Top Link Bar' link
From here, click on 'New Link'


Now copy the URL for the Service Level Dashboard web page into the field as shown and then click 'OK'


You now have an additional tab for your 'SCOM Service Level Dashboard' and when you click on the tab, it opens up your SLD page


When you open your SLD page, click on the 'Site Settings' option to add the SCOM Dashboard tabs to this webpage

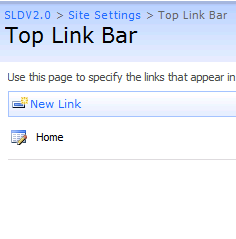
Again, in the 'Look and Feel' section, click on the 'Top Link Bar' to make the customisations. When you see the screen below, click on the icon beside 'Home' to edit the name of the Home tab.

Change the name of the 'Home' tab to something like 'SCOM Service Level Dashboard' as shown below, then click 'OK'


Now click on the 'New Link' button from the 'Top Link Bar' to create the other tabs for the SCOM dashboard


From the window below, copy the URL for your previously created 'SCOM Admin Dashboard' and type 'SCOM Admin Dashboard' into the description field as below, then click 'OK'


Now for the final time, click on the 'New Link' button again from the window below

This time, copy the URL for your previously created SCOM Distributed Applications Health State Dashboard into the web address field and type the description as shown below, then click 'OK'


Your top link bar from within the Service Level Dashboard site settings window should now look something like this


Click on the 'Change Order' button to move the order of the tabs around to reflect the same order that you have from within your SCOM Admin Dashboard to provide a seamless integration look to both dashboards. Once you are happy with the order of the tabs, click 'OK' to complete the tab editing


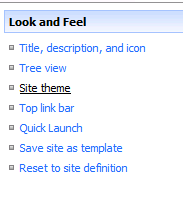
Now all that's left to do is to change the theme of the SCOM Service Level Dashboard to look similar to the other SCOM dashboards. We do this by clicking on 'Site Actions' on the right hand side and then selecting 'Site Settings' again. When this opens, click on 'Site Theme' from within the 'Look and Feel' column

I have used the default SCSM dashboard theme of 'Obsidian' for my other dashboards so I will again choose this for the SCOM Service Level Dashboard by highlighting it and then clicking on 'Apply'


Your final SCOM Service Level Dashboard with associated SCOM dashboard tabs should now look like this


This completes your configuration of the SCOM dashboard solution that incorporates a SCOM Admin Dashboard, SCOM Distributed Application Dashboard and a SCOM Service Level Dashboard as three separate tabs within one web browser view.

The final post of this series will summarise what we have achieved so far, will provide web links to sites that I have found very useful when working with dashboards in SCOM and will provide some of the SQL queries that I have used to create these web parts.

SCOM Dashboards - Part 7 - The SCOM Distributed Application Health State Tab

Before reading this post, please ensure you have reviewed my previous posts on SCOM Dashboarding from the links below:

SCOM Dashboards - The Intro
SCOM Dashboards - Part 1 - Installing WSS 3.0
SCOM Dashboards - Part 2 - Installing the Dashboard Solution Accelerator
SCOM Dashboards - Part 3 - Customizing the Dashboard Banner and Logo
SCOM Dashboards - Part 4 - Customizing the Dashboard Tabs
SCOM Dashboards - Part 5 - Installing the Service Level Dashboard (SLD 2.0)
SCOM Dashboards - Part 6 - Adding SQL Queries to the Dashboards

Next we are going to modify the 'SCOM Distributed Applications Health State' tab and provide a live view of the health state of all your DA's through the dashboard

Click on the 'Edit page' link as below to continue


Now we are going to remove all of the existing SCSM web parts simply by clicking on the 'X' beside each one until we get a screen that looks like this


Configure your Dataset exactly as shown below otherwise the DA health states and colours will be incorrect (the SQL query will be specific to your own site in relation to the DA names however and you can get the SQL query I used from Steve Beaumont's blog credited here)


The Score Card label and value information below is VERY IMPORTANT and needs to be exact!


Next up is to add a new web part to the horizontal bottom section of the screen as shown


Select the 'Microsoft Dashboard Viewer' option


Now from this newly created web part, click on the 'Edit' button, and then select 'Modify Shared Web Part' from the list


From the menu on the right hand side of the screen, select the 'DAHealthState' dataset that was configured earlier, and then click 'OK' to close the window

You should now have a tab that looks something like this


The penultimate Part 8 post of this SCOM Dashboard blog series will demonstrate how to create a new tab alongside your SCOM Dashboard and SCOM Distributed Application Health State Dashboard tabs that includes the Service Level Dashboard 2.0.

SCOM Dashboards - Part 6 - Adding SQL Queries to the Dashboards

Before reading this post, please ensure you have reviewed my previous posts on SCOM Dashboarding from the links below:

SCOM Dashboards - The Intro
SCOM Dashboards - Part 1 - Installing WSS 3.0
SCOM Dashboards - Part 2 - Installing the Dashboard Solution Accelerator
SCOM Dashboards - Part 3 - Customizing the Dashboard Banner and Logo
SCOM Dashboards - Part 4 - Customizing the Dashboard Tabs
SCOM Dashboards - Part 5 - Installing the Service Level Dashboard (SLD 2.0)

To customise your SCOM Dashboard and remove the pre-inserted SCSM web parts, follow the screens below:

Open your SCOM Dashboard and click on 'Edit Page' from the menu on the right hand side


Input in a new Dataset Configuration Name, add your SQL Server and instance name, add your OperationsManager database name and copy and paste your SQL query into the SQL Query window as below (SQL queries can be obtained from the list of community blog references in the final part of this series)


Select 'Parse Query' and then 'Validate Query' and ensure you get the green tick and preview data before continuing


Expand 'Charts', leave 'Pie' selected and then click 'Add' to create a Pie Chart with your SQL query information. Fill out the fields similar to the graphic below


Once this is completed, click on 'Save and Close' to complete the new SQL query injection

Now what you need to do is to add your new 'Top20AlertsbyRepeatCount.xml' file into an existing Web Part for display within your dashboard

Click on an the 'edit' button from within an existing web part on the dashboard and select 'Modify Shared Web Part'


This will open the web part for editing on the right hand side of the screen. From here, use the 'Select Data Set Configuration' button and highlight your previously created SQL query as below

 
Next, put an entry into the 'Title' field to give your new web part a name and then leave all of the other settings as they are and click on 'OK'

 
This should now replace the old SCSM web part on the dashboard with your new 'Top 20 Alerts by Repeat Count' dashboard as shown below


Repeat this process as many times as you like using different SQL queries and chart types and then changing the existing SCSM web parts one by one until you get the dashboard that you want for your business

If you want to remove any excess web parts and tidy up the dashboard a bit, then all you need to do is to select the 'X' in the corner beside the 'Edit' button to remove it completely

Your final SCOM Dashboard tab should look something like this:


With the SCOM dashboard itself finished now, in Part 7 I will describe how to create a scorecard web part that acts as a Distributed Application Health State dashboard.

SCOM Dashboards - Part 5 - Installing the Service Level Dashboard (SLD 2.0)

Before reading this post, please ensure you have reviewed my previous posts on SCOM Dashboarding from the links below:

SCOM Dashboards - The Intro
SCOM Dashboards - Part 1 - Installing WSS 3.0
SCOM Dashboards - Part 2 - Installing the Dashboard Solution Accelerator
SCOM Dashboards - Part 3 - Customizing the Dashboard Banner and Logo
SCOM Dashboards - Part 4 - Customizing the Dashboard Tabs

Download the Service Level Dashboard 2.0 from the following URL:

http://www.microsoft.com/downloads/en/details.aspx?FamilyId=1d9d709f-9628-46a8-952b-a78f5dd2bdd9&displaylang=en

Export the contents of the ZIP file to a folder on your SCOM management server


Import the Management pack highlighted below into SCOM

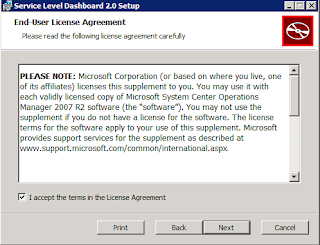
From the Management Server that is hosting the WSS 3.0 and SCOM dashboard websites, run the installer highlighted below with administrator rights.


Copy the URL from the URL field below so we can use this to quickly logon to the SLD for the first time


Open Internet Explorer and browse to the URL for the SLD that was noted during the install - typically something like: http://managementservername:51918

Click on 'Site Settings' to modify the users and groups allowed to access the website


Select 'People and Groups'


Now click on 'Add Users' to add new users to your group


Add the users or groups and select 'Full Control', then click 'OK'


From the SLD Home page, click on the options below to add previously created service level objects for your distributed applications into the SLD


Click on the available Service Levels from the list and then select 'Apply Filter'


When you go back to your home page, you should see something like the screen below


This completes the installation of your Service Level Dashboard 2.0. In Part 6 of this series, I will demonstrate how to add SQL queries to your SCOM dashboard and create web parts with them.