Following on from my last post on the new '3-Tier (360)' Service Template, this post will go through the steps required to create a synthetic transaction within System Center 2012 Operations Manager (SCOM 2012) that will monitor a website URL and report back on latency or authentication errors.
The System Center 2012 Private Cloud Community Evaluation Program has been running for the last few months now and this weeks session was based mainly around the new System Center 2012 App Controller (AppController) product and it's management of private and public clouds combined.
Anyone can apply to join up to the System Center 2012 Private Cloud CEP and you can get more information from the link below:
https://connect.microsoft.com/site799/program7383
Keeping with the theme of the System Center 2012 Private Cloud CEP, I've decided to dedicate this post to the AppController management website URL and show how you can use SCOM to monitor its health state. You can however use the steps in this post to create a synthetic transaction web monitor for any URL you wish.
To get started, open up your SCOM 2012 console and click on the 'Authoring' tab down the bottom left hand side of the screen. Once you have this open, expand 'Management Pack Templates' on the left hand side and then right mouse click on 'Web Application Transaction Monitoring' as below
From the 'Add Monitoring Wizard', select 'Web Application Transaction Monitoring' as the monitoring type, then click 'Next'
Now enter in a friendly name for your website monitoring synthetic transaction, select an unsealed management pack to store it in, then click 'Next'
In the 'URL' field, input in the full URL of the System Center 2012 App Controller management website that you want to monitor and then click the 'Test' button (this URL doesn't have to be the AppController one and can be any website address that you like including over http or https). When you are happy with the results of the test, click 'Next' to continue
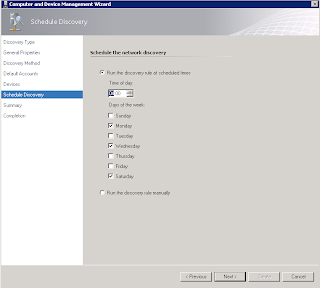
From the 'Watcher Node' screen, choose a server from the list that will be allocated the task of running the synthetic transaction. Specify also here how often you want this test to run from the watcher node server (e.g. every 15 minutes)
When you get to the final screen of the wizard, tick the box for 'Configure Advanced Monitoring or Record a browser session' and then click 'Create'
Once the monitoring wizard has created the synthetic transaction, the 'Web Application Editor' window will open and it is here that we can configure parameters to report back on things like the http status code, content matches and response times for your chosen website URL
If you click on the drop down menus in the 'Http Status Code' section, you can select a number of options to suit the error checking you want SCOM to report back on
For this transaction, I've selected 'Greater than or eqals' for the '401 - Unauthorised' http error code
and here, I've specifed a response time of 'Greater than or equals' to '10 seconds' which means if it takes 10 seconds or more to open up my chosen website URL, then SCOM will report back with an error based on these criteria. We can configure the same or similar parameters in the section below but this will report back as a 'Warning' instead of an 'Error'
Ensure to click on the 'Verify' button when you've made the changes you want
To complete, click on the 'Apply' button
To test your newly created web monitor, click on the 'Run Test' link on the right hand side of the screen and you will then be presented with a results screen detailing what the outcome of the test is as shown below
All that's left to do now is to close out of the test results and go back to the main 'Monitoring' tab within the SCOM console by clicking on the button down the left hand side of the screen. When here, locate the 'Web Application Transaction Monitoring' folder and expand it to show the 'Web Applications State' screen where you should see your newly created System Center 2012 App Controller Website synthetic transaction monitor
If you want to know more about System Center 2012 App Controller, then take a look at some of my previous posts from the links below:
Cloud Management with System Center - Connecting your private cloud to System Center App Controller 2012
Cloud Management with System Center - Customizing System Center App Controller 2012
Cloud Management with System Center - Connecting App Controller to Azure Part 1
Cloud Management with System Center - Connecting App Controller to Azure Part 2
Cloud Management with System Center - Integrating App Controller with SCOM
Thursday, January 12, 2012
Wednesday, January 11, 2012
SCOM 2012 - The All New 3 Tier Application (360) Service Template
If you have been reading my previous posts around the upcoming System Center 2012 suite of products, then you’ll know that Microsoft are changing the way we manage and monitor our IT infrastructures.
Gone are the days of SILO based management where you might get a request from your developer team to build them a new virtualized SharePoint farm, where you then have to go about creating each virtual machine one by one and then installing the applications into each one before patching, adding to the domain and dealing with all of the other tricky little pieces that comes with these type of requests.
With System Center 2012 Virtual Machine Manager, Microsoft have introduced the idea of service templates whereby you can build a template of say a Sharepoint application that would contain all of the components that make up that service. Once the template was built, then it could be used over and over again to deploy that type of service with a few clicks of the mouse! The link below goes into more detail on this:
Creating a Service Template with System Center Virtual Machine Manager 2012
In SCOM though, the idea of having a distributed application that gives monitoring transparency of your whole service through a single top-level icon made up of a number of sub-components has been around for a long time now and the deployment of these distributed application services is made all the easier through SCOM 'Distributed Application Templates'.
With the release of System Center 2012 Operations Manager (SCOM 2012), there's a new addition to the 'Distributed Application Templates' that we can use to quickly deploy monitoring across your entire IT estate called the '3 Tier Application (360)' template.
The following screens will walkthrough this new template and show some of the new graphics available with SCOM 2012 through the use of Silverlight.
To begin, open up the SCOM 2012 console and click on the 'Authoring' tab on the left hand side of the screen, right mouse click on the 'Distributed Applications' link up the top left hand side and select 'Create a new distributed application' from the drop down menu as below
The first screen you see after this is the 'Create a Distributed Application' window and you will notice that in the 'Template' section, there is the new '3 Tier Application (360)' template for you to select.
Type in a name and description, select the new '3 Tier Application (360)' template, choose an unsealed management pack to save it into and then select 'OK' to continue
The 'Distributed Application Designer' window will then open and will present you with four pre-configured component groups and associated relationships between each of them as shown below
I've populated each of the component groups with some of their associated objects such as client perspectives, .Net applications, SQL databases and sharepoint websites in the screen below
Once the distributed application service has been configured, click on the 'Save' button within the 'Distributed Application Designer' to return to the 'Authoring' screen. Once here, right mouse click on your newly created service and then select the 'View Diagram' option from the drop down menu
This will open up your newly created service in the new SCOM 2012 console utilising the power of Microsoft Silverlight to present a nice quick and sharp diagram view like the one below
If I expand out the newly created distributed application service, we can really get a clear view of what is going on in my environment and all of the sub-components that make up my service
With the help of the new SCOM 2012 '3 Tier Application (360)' template, I had the above example setup and configured in less than 5 minutes!!
This post also coincides with the new Microsoft System Center 2012 Private Cloud Community Evaluation Program and you can still sign up at any time to the CEP by clicking on the link below (you will need a Microsoft Live ID to sign in):
Monday, January 9, 2012
SCOM 2012 - Network Monitoring Magic!
This is the first of many posts I'll be blogging this year on System Center 2012 Operations Manager (SCOM 2012). With the upcoming RTM release of SCOM 2012 just around the corner, I've been test driving most of the System Center 2012 products for the last 6 or 7 months in conjunction with the Microsoft System Center 2012 Private Cloud Community Evaluation Program (CEP).
In the past, network monitoring within SCOM 2007 R2 was badly lacking out of the box and it could be quite cumbersome to configure using the built in SNMP functionality that came as part of the original build. Microsoft had no monitoring pack of their own available either that could build on this basic functionality and it was left to the SCOM community and 3rd party companies to create the management packs that would then allow all of the network devices within an infrastructure to be monitored easily.
One of the best management packs that I've used to complement SCOM 2007 R2 for SNMP network device monitoring was created by SCOM community member Kris Bash and distributed free of charge through Codeplex - see the link below for more info:
http://xsnmp.codeplex.com/
Kris did an excellent job with this management pack and it still forms an integral part of all SCOM 2007 R2 deployment projects that I'm involved in since I came across it in 2009 and the fact that it's a free download keeps it miles apart from its nearest 3rd party (costly) competitor!
In fairness to Microsoft, they took all of this onboard when developing the roadmap for SCOM 2012 and decided to hire Kris Bash to work for them directly on the SCOM 2012 product team ('if you can't beat them hire them' maybe....)!
This post will show an example now of exactly what that means for the latest version of Microsoft's monitoring application and how easy it is to get up and running with your SNMP discoveries.
To begin, open up the SCOM 2012 Management Console, go to the 'Administration' tab on the left hand side and then right mouse click on 'Discovery Wizard' to bring your network SNMP devices directly into SCOM without the need to add any additional management packs.
Once the Discovery Wizard opens up, select 'Network Devices' and then click 'Next'
It's at this point that people familar with SCOM 2007 R2 will start to see some new screens and functionality. When discovering network devices within SCOM 2007 R2, you only had the option to either input in a single IP address of a network device along with its associated SNMP community string or you could search for a range of devices using the subnet range method along with a single SNMP community string. Once this SCOM 2007 R2 network device search was complete, you lost all of your search settings and then had to re-enter them again if you wanted to do another search.
SCOM 2012 allows us to to create and save custom network device searches along with the capability to use a number of different SNMP community strings against explicit or recursive discoveries. This is a MAJOR change to SCOM 2007 R2 and I can see this making our future SCOM installs so much easier to handle disparate network discoveries in Enterprise environments.
From the screen below, enter a name for your new Discovery Rule, select a Management or Gateway server that you want your network devices to report to and choose a Resource Pool from the 'Available Pools' option down the bottom - leave this at the default of 'All Management Servers Resource Pool' if you don't want to create a new one - and then click 'Next' to continue.
In the next screen, select either an 'Explicit Discovery' or a 'Recursive Discovery' and then click 'Next'.
(If you want to learn more about Explicit and Recursive discovery rules, then check out this other blog post of mine)
When you click onto the next screen, it is here that you will be able to create the 'RunAs' accounts for your SNMP discoveries that allow you to specify different SNMP versions and community strings that can apply to all network devices from a single search. Click on 'Create Account' to kick off the wizard for a new RunAs account.
Input a display name and desciption for the discovery account and then click 'Next'
Now enter in your SNMP community string, then click 'Create'
In the example below, I've created two different discovery accounts, both with different SNMP community strings. Select the one(s) that you want to use for this particular discovery, then click 'Next'
You will be prompted to distribute the new RunAs accounts to the health service on the Management server that was specified for the network devices to report into. Click 'Yes' and then click 'Next' to move on.
Now specify the device or the network devices that you want to use as your starting point for your recursive searches and then click 'Advanced Discovery Settings'
You can change any of the options here to suit your search and when happy, click on 'OK' and then click on 'Next' to continue
Select your recursive discovery search options from the screen below and then click 'Next'
You can specify what network devices to exclude from your recursive search from the screenshot below, click 'Next' when you're ready to move on
This is another cool new feature where you can schedule the discovery rule to fire any day you want at any time
Now if you click on the 'Discovery Rules' link on the left hand side of the screen, you can see the status of your rule as it changes from an 'idle' state to 'processing' to back to 'idle' again. If you chose to run this rule just the once, then it will remain in an idle state until you kick it off manually again. If you configured a schedule for your rule to fire, you will be able to check here to see the status of the rule running during the schedule times specified.
Once complete, you should see the screen below telling you the discovery was a success.
Now when you go to your 'Network Devices' link on the left, you will see that it is starting to populate with the newly discovered SNMP network devices
Once you are happy that all of your devices have been discovered, go back to the 'Monitoring' tab on the left hand side of the Wunderbar, expand the 'Network Monitoring folder and then click on one of your network switches in the list from the central screen.
Now click on the 'Network Vicinity Dashboard' option from the 'Tasks' pane on the right hand side
If you want to learn more about the other great System Center 2012 products and how they interact with each other, see my previous posts from the links below:
Cloud Management with System Center - Building a Private Cloud with System Center Virtual Machine Manager 2012
Cloud Management with System Center - Creating a Virtual Machine Template with System Center Virtual Machine Manager 2012
Cloud Management with System Center - Creating a Service Template with System Center Virtual Machine Manager 2012
Cloud Management with System Center - Connecting your private cloud to System Center App Controller 2012
Cloud Management with System Center - Customizing System Center App Controller 2012
Cloud Management with System Center - Connecting App Controller to Azure Part 1
Cloud Management with System Center - Connecting App Controller to Azure Part 2
Cloud Management with System Center - Integrating App Controller with SCOM
Managing and Monitoring System Center DPM 2012 with SCOM Part 1
Enjoy!!
In the past, network monitoring within SCOM 2007 R2 was badly lacking out of the box and it could be quite cumbersome to configure using the built in SNMP functionality that came as part of the original build. Microsoft had no monitoring pack of their own available either that could build on this basic functionality and it was left to the SCOM community and 3rd party companies to create the management packs that would then allow all of the network devices within an infrastructure to be monitored easily.
One of the best management packs that I've used to complement SCOM 2007 R2 for SNMP network device monitoring was created by SCOM community member Kris Bash and distributed free of charge through Codeplex - see the link below for more info:
http://xsnmp.codeplex.com/
Kris did an excellent job with this management pack and it still forms an integral part of all SCOM 2007 R2 deployment projects that I'm involved in since I came across it in 2009 and the fact that it's a free download keeps it miles apart from its nearest 3rd party (costly) competitor!
In fairness to Microsoft, they took all of this onboard when developing the roadmap for SCOM 2012 and decided to hire Kris Bash to work for them directly on the SCOM 2012 product team ('if you can't beat them hire them' maybe....)!
This post will show an example now of exactly what that means for the latest version of Microsoft's monitoring application and how easy it is to get up and running with your SNMP discoveries.
To begin, open up the SCOM 2012 Management Console, go to the 'Administration' tab on the left hand side and then right mouse click on 'Discovery Wizard' to bring your network SNMP devices directly into SCOM without the need to add any additional management packs.
Once the Discovery Wizard opens up, select 'Network Devices' and then click 'Next'
It's at this point that people familar with SCOM 2007 R2 will start to see some new screens and functionality. When discovering network devices within SCOM 2007 R2, you only had the option to either input in a single IP address of a network device along with its associated SNMP community string or you could search for a range of devices using the subnet range method along with a single SNMP community string. Once this SCOM 2007 R2 network device search was complete, you lost all of your search settings and then had to re-enter them again if you wanted to do another search.
SCOM 2012 allows us to to create and save custom network device searches along with the capability to use a number of different SNMP community strings against explicit or recursive discoveries. This is a MAJOR change to SCOM 2007 R2 and I can see this making our future SCOM installs so much easier to handle disparate network discoveries in Enterprise environments.
From the screen below, enter a name for your new Discovery Rule, select a Management or Gateway server that you want your network devices to report to and choose a Resource Pool from the 'Available Pools' option down the bottom - leave this at the default of 'All Management Servers Resource Pool' if you don't want to create a new one - and then click 'Next' to continue.
In the next screen, select either an 'Explicit Discovery' or a 'Recursive Discovery' and then click 'Next'.
(If you want to learn more about Explicit and Recursive discovery rules, then check out this other blog post of mine)
When you click onto the next screen, it is here that you will be able to create the 'RunAs' accounts for your SNMP discoveries that allow you to specify different SNMP versions and community strings that can apply to all network devices from a single search. Click on 'Create Account' to kick off the wizard for a new RunAs account.
Input a display name and desciption for the discovery account and then click 'Next'
Now enter in your SNMP community string, then click 'Create'
In the example below, I've created two different discovery accounts, both with different SNMP community strings. Select the one(s) that you want to use for this particular discovery, then click 'Next'
You will be prompted to distribute the new RunAs accounts to the health service on the Management server that was specified for the network devices to report into. Click 'Yes' and then click 'Next' to move on.
Now specify the device or the network devices that you want to use as your starting point for your recursive searches and then click 'Advanced Discovery Settings'
You can change any of the options here to suit your search and when happy, click on 'OK' and then click on 'Next' to continue
Select your recursive discovery search options from the screen below and then click 'Next'
You can specify what network devices to exclude from your recursive search from the screenshot below, click 'Next' when you're ready to move on
This is another cool new feature where you can schedule the discovery rule to fire any day you want at any time

Finally, click on 'Save' to complete the discovery wizard and search creation
Before you click 'Close' from the screen below, ensure you have enabled the 'Run the network discovery rule after the wizard is closed' option
Now if you click on the 'Discovery Rules' link on the left hand side of the screen, you can see the status of your rule as it changes from an 'idle' state to 'processing' to back to 'idle' again. If you chose to run this rule just the once, then it will remain in an idle state until you kick it off manually again. If you configured a schedule for your rule to fire, you will be able to check here to see the status of the rule running during the schedule times specified.
Once complete, you should see the screen below telling you the discovery was a success.
Now when you go to your 'Network Devices' link on the left, you will see that it is starting to populate with the newly discovered SNMP network devices
Once you are happy that all of your devices have been discovered, go back to the 'Monitoring' tab on the left hand side of the Wunderbar, expand the 'Network Monitoring folder and then click on one of your network switches in the list from the central screen.
Now click on the 'Network Vicinity Dashboard' option from the 'Tasks' pane on the right hand side
Hey presto! The screenshot below now shows the brand new and fresh out of the box functionality of the SCOM 2012 Network Monitoring Vicinity and Availability view!!
If you want to learn more about the other great System Center 2012 products and how they interact with each other, see my previous posts from the links below:
Cloud Management with System Center - Building a Private Cloud with System Center Virtual Machine Manager 2012
Cloud Management with System Center - Creating a Virtual Machine Template with System Center Virtual Machine Manager 2012
Cloud Management with System Center - Creating a Service Template with System Center Virtual Machine Manager 2012
Cloud Management with System Center - Connecting your private cloud to System Center App Controller 2012
Cloud Management with System Center - Customizing System Center App Controller 2012
Cloud Management with System Center - Connecting App Controller to Azure Part 1
Cloud Management with System Center - Connecting App Controller to Azure Part 2
Cloud Management with System Center - Integrating App Controller with SCOM
Managing and Monitoring System Center DPM 2012 with SCOM Part 1
Enjoy!!
Wednesday, January 4, 2012
SCOM - Enable Agent Proxy Setting for all Installed Agents
This is a quick post and mostly for my own reference but some people may find it interesting or useful.
When deploying SCOM agents in an environment, there is an 'Agent Proxy' setting that is disabled by default on all newly installed agents titled:
'Allow this agent to act as a proxy and discover managed objects on other computers'
If you install an agent onto for example, an Active Directory, SQL or Exchange server and leave this setting disabled, then SCOM will detect the agent as only being of the 'Windows Server' class and will not allow discovery of Active Directory, Exchange or SQL roles and attributes.
This setting is disabled by default as there is a potential risk associated by allowing an agent to discover external managed objects.
When installing a new SCOM solution, I tend to deploy agents to all of the servers that I know will need this setting switched on first (Exchange, AD, SQL, Hyper-V etc.). I then run a powershell command that turns this setting on for all of these agents in one quick swoop!!
Once all of the agents that I want to have this enabled on have it enabled, then I install the remaining Windows agents and leave the setting as its default of 'disabled'.
Here's how to do it:
Go to the 'Security' tab within the newly installed agent from the SCOM Administration console tab and check to see if the settings is disabled as below
Open up the 'Operations Manager' shell from a SCOM Management Server with administrative permissions as below:
When you have the Operations Manager Shell window opened as above, copy the script below into it and hit 'Enter'
Easy!!
Keep in mind that this is just a simple powershell script that will enable the setting for all agents so if you want to specifically enable just a small amount and not the whole lot of them, then this isn't the script for you!!
When deploying SCOM agents in an environment, there is an 'Agent Proxy' setting that is disabled by default on all newly installed agents titled:
'Allow this agent to act as a proxy and discover managed objects on other computers'
If you install an agent onto for example, an Active Directory, SQL or Exchange server and leave this setting disabled, then SCOM will detect the agent as only being of the 'Windows Server' class and will not allow discovery of Active Directory, Exchange or SQL roles and attributes.
This setting is disabled by default as there is a potential risk associated by allowing an agent to discover external managed objects.
When installing a new SCOM solution, I tend to deploy agents to all of the servers that I know will need this setting switched on first (Exchange, AD, SQL, Hyper-V etc.). I then run a powershell command that turns this setting on for all of these agents in one quick swoop!!
Once all of the agents that I want to have this enabled on have it enabled, then I install the remaining Windows agents and leave the setting as its default of 'disabled'.
Here's how to do it:
Go to the 'Security' tab within the newly installed agent from the SCOM Administration console tab and check to see if the settings is disabled as below
Open up the 'Operations Manager' shell from a SCOM Management Server with administrative permissions as below:
When you have the Operations Manager Shell window opened as above, copy the script below into it and hit 'Enter'
## Enable Agent Proxy for all agents where it is disabled
$NoProxy = get-agent | where {$_.ProxyingEnabled -match "false"}
$NoProxy|foreach {$_.ProxyingEnabled = $true}
$NoProxy|foreach {$_.ApplyChanges()}Updated 5th May 2012: The script above will only work on SCOM 2007 R1/R2 and not SCOM 2012. See below for the SCOM 2012 equivalent:
## Enable Agent Proxy for all agents where it is disabled
$NoProxy = get-scomagent | where {$_.ProxyingEnabled -match "false"}
$NoProxy|foreach {$_.ProxyingEnabled = $true}
$NoProxy|foreach {$_.ApplyChanges()}
$NoProxy = get-scomagent | where {$_.ProxyingEnabled -match "false"}
$NoProxy|foreach {$_.ProxyingEnabled = $true}
$NoProxy|foreach {$_.ApplyChanges()}
Updated (again!) 24th August 2012 - My good buddy Bob Cornelissen (fellow co-author of Mastering System Center 2012 Operations Manager and SCOM/OpsMgr ninja warrior) has just posted an even easier one-liner PowerShell command to enable agent proxy for all of your machines. Check out his post here and see his script below:
Get-SCOMAgent | where {$_.ProxyingEnabled.Value -eq $False} | Enable-SCOMAgentProxy
Once you have run the script above in the Operations Manager Shell window, go back to the 'Agents' window and open up your agents 'Security' tab again. You should now see that all agents present when you ran the powershell command have changed their 'Agent Proxy' setting to enabled!!
Easy!!
Keep in mind that this is just a simple powershell script that will enable the setting for all agents so if you want to specifically enable just a small amount and not the whole lot of them, then this isn't the script for you!!
Wednesday, December 7, 2011
System Center 2012 Private Cloud Community Evaluation Program contest winner!!
Nice to see the email last night arrive into my inbox telling me that I had won the November competition for the Microsoft System Center 2012 Private Cloud Community Evaluation Program (CEP) as a result of my blog posts on 'Cloud Management with System Center'.
There were two aspects of the prize - a brand new Microsoft Touch Mouse and entry into a draw in February for a free MMS 2012 ticket!
If you want to learn more about Cloud Management with System Center, click on the links below for my posts:
Cloud Management with System Center - Building a Private Cloud with System Center Virtual Machine Manager 2012
Cloud Management with System Center - Creating a Virtual Machine Template with System Center Virtual Machine Manager 2012
Cloud Management with System Center - Creating a Service Template with System Center Virtual Machine Manager 2012
Cloud Management with System Center - Connecting your private cloud to System Center App Controller 2012
Cloud Management with System Center - Customizing System Center App Controller 2012
Cloud Management with System Center - Connecting App Controller to Azure Part 1
Cloud Management with System Center - Connecting App Controller to Azure Part 2
Cloud Management with System Center - Integrating App Controller with SCOM
The System Center 2012 Private Cloud CEP is running up until February and is open to anyone who wants to sign up. Click on the link below to start learning about how System Center is changing the way we manage our cloud infrastructures:
http://connect.microsoft.com/site799/program7383
Enjoy!
Thursday, November 24, 2011
Cloud Management with System Center - Integrating App Controller with SCOM
As part of my Year Zero session presentation, I wanted to show the integration between a number of System Center products while highlighting Cloud Management and the IT as a Service model.
As System Center App Controller 2012 is still in BETA and the integration between all the System Center 2012 products is still not fully finished, I decided to do my own type of basic integration to allow an administrator to manage their clouds from the same server / screen that they are using for their SCOM console. I decided to create a custom SCOM task that can launch the App Controller Console from within a SCOM Distributed Application
This is more a customisation than integration but none the less – it works for me until we get a Management Pack for App Controller into SCOM 2012!
To begin, you need to have already installed System Center App Controller 2012 and configured it with your public and or private clouds. See the links below for more information on App Controller as part of this blog series:
Installing System Center App Controller 2012
Cloud Management with System Center - Connecting your private cloud to App Controller
Cloud Management with System Center - Connecting App Controller to Azure
Deploying the SCOM Agent
When you have App Controller installed, you need to deploy the SCOM agent to the App Controller server.
I’ll be carrying these steps out on a SCOM 2007 R2 server as opposed to SCOM 2012 as SCOM 2007 R2 is more prevalent at the moment and will be the main production monitoring application people are using for the coming months. These steps will work exactly the same however with SCOM 2012.
Follow the screens below to complete the 'Discovery Wizard' and to install the SCOM Windows agent onto your App Controller server.
Once the above steps have been completed, you should then have your SCOM agent deployed to your System Center App Controller 2012 server.
Creating the Custom Task
At this point, you should have your SCOM agent deployed to your App Controller server and a custom group created that includes the new App Controller agent.
To enable us to launch the App Controller console from the SCOM console, we need to create a custom task within SCOM that evokes a URL shortcut to the App Controller console.
First, logon to your App Controller server and double click on the App Controller icon on the desktop
When the console logon window opens, just copy or make a note of the full URL address in the address bar
Now, log back onto the server with your SCOM console installed. Open up Internet Explorer and browse to the App Controller URL shortcut.
Once it opens, click on ‘File’, ‘Send’ and select ‘Shortcut to Desktop’. This will create a shortcut on the desktop of your SCOM console server that links back to the App Controller console on your App Controller server. Move this shortcut now to a folder on the ‘C’ drive called ‘SCOMCustomTasks’
Now, open up the SCOM console, go to the ‘Authoring’ tab in the Wunderbar, expand ‘Management Pack Objects’, right mouse click on ‘Tasks’ and then select ‘Create a New Task’ as below
In the 'Create Task Wizard' window, select 'Console Tasks' and then 'Command Line', ensure you are saving the new task to a custom unsealed Management Pack (that IS NOT the 'Default Management Pack!) then click 'Next'
Enter a description for the custom task and then select the 'Windows Server' class as the target as below
Now in the 'Application' field, type the text below (the path below presumes you have followed all of the above steps and have created the folder and shortcut names identically):
"C:\SCOMCustomTasks\App Controller.url"
Untick the 'Display output when task is run' box and then click 'Create' to complete the custom task creation.
Once you have your custom task created, anytime you click on your System Center App Controller server within SCOM, you will see the 'App Controller Console Launch' action present in the 'Actions' window on the right hand side of the screen.
The screenshot below is the Distributed Application Service that I built for the Year Zero event and I have highlighted in RED the App Controller server in the diagram and its associated custom task on the right.
Notice also, that this process is not by any means specific to just App Controller. If you look at the diagram above you will see I have created a similar custom task to enable me to launch my System Center Orchestrator 2012 console too (see the 'Orchestrator Console Launch' action on the right).
Now thats what I call central management with SCOM!!!!
As System Center App Controller 2012 is still in BETA and the integration between all the System Center 2012 products is still not fully finished, I decided to do my own type of basic integration to allow an administrator to manage their clouds from the same server / screen that they are using for their SCOM console. I decided to create a custom SCOM task that can launch the App Controller Console from within a SCOM Distributed Application
This is more a customisation than integration but none the less – it works for me until we get a Management Pack for App Controller into SCOM 2012!
This post also coincides with the new Microsoft Private Cloud Community Evaluation Program starting up and you can sign up at any time to the CEP by clicking on the link below (you will need a Microsoft Live ID to sign in):
To begin, you need to have already installed System Center App Controller 2012 and configured it with your public and or private clouds. See the links below for more information on App Controller as part of this blog series:
Installing System Center App Controller 2012
Cloud Management with System Center - Connecting your private cloud to App Controller
Cloud Management with System Center - Connecting App Controller to Azure
Deploying the SCOM Agent
When you have App Controller installed, you need to deploy the SCOM agent to the App Controller server.
I’ll be carrying these steps out on a SCOM 2007 R2 server as opposed to SCOM 2012 as SCOM 2007 R2 is more prevalent at the moment and will be the main production monitoring application people are using for the coming months. These steps will work exactly the same however with SCOM 2012.
Follow the screens below to complete the 'Discovery Wizard' and to install the SCOM Windows agent onto your App Controller server.
Once the above steps have been completed, you should then have your SCOM agent deployed to your System Center App Controller 2012 server.
Creating the Custom Task
At this point, you should have your SCOM agent deployed to your App Controller server and a custom group created that includes the new App Controller agent.
To enable us to launch the App Controller console from the SCOM console, we need to create a custom task within SCOM that evokes a URL shortcut to the App Controller console.
First, logon to your App Controller server and double click on the App Controller icon on the desktop
When the console logon window opens, just copy or make a note of the full URL address in the address bar
Now, log back onto the server with your SCOM console installed. Open up Internet Explorer and browse to the App Controller URL shortcut.
Once it opens, click on ‘File’, ‘Send’ and select ‘Shortcut to Desktop’. This will create a shortcut on the desktop of your SCOM console server that links back to the App Controller console on your App Controller server. Move this shortcut now to a folder on the ‘C’ drive called ‘SCOMCustomTasks’
Now, open up the SCOM console, go to the ‘Authoring’ tab in the Wunderbar, expand ‘Management Pack Objects’, right mouse click on ‘Tasks’ and then select ‘Create a New Task’ as below
In the 'Create Task Wizard' window, select 'Console Tasks' and then 'Command Line', ensure you are saving the new task to a custom unsealed Management Pack (that IS NOT the 'Default Management Pack!) then click 'Next'
Enter a description for the custom task and then select the 'Windows Server' class as the target as below
Now in the 'Application' field, type the text below (the path below presumes you have followed all of the above steps and have created the folder and shortcut names identically):
"C:\SCOMCustomTasks\App Controller.url"
Untick the 'Display output when task is run' box and then click 'Create' to complete the custom task creation.
Once you have your custom task created, anytime you click on your System Center App Controller server within SCOM, you will see the 'App Controller Console Launch' action present in the 'Actions' window on the right hand side of the screen.
The screenshot below is the Distributed Application Service that I built for the Year Zero event and I have highlighted in RED the App Controller server in the diagram and its associated custom task on the right.
Notice also, that this process is not by any means specific to just App Controller. If you look at the diagram above you will see I have created a similar custom task to enable me to launch my System Center Orchestrator 2012 console too (see the 'Orchestrator Console Launch' action on the right).
Now thats what I call central management with SCOM!!!!
Subscribe to:
Posts (Atom)


