Showing posts with label SQL. Show all posts

Tuesday, February 14, 2017

Scandinavian SCOM Solutions with a Global Reach

A few months before the Christmas break, I had the pleasure of being invited over to the excellent SCOM Day event in Sweden to present a session and hang out with some of my friends from the Scandinavian region.


The event was organised by Approved Consulting in Gothenburg and the target audience had a mix of IT administrators, consultants and senior IT managers. This was my first-time visiting Sweden and from the venue, to the food, the craft beers and of course, the people, it was a really enjoyable experience.

While I was over there, I had the chance to sit down with Approved CEO Jonas Lenntun and go through some of the solutions they offer to complement System Center and OMS. I was already aware of the free community SCOM Health Check Report they released a couple of years ago (if you haven’t tried this out yet, then download it from here):


Free solutions like this for SCOM are always good and the Health Check Report delivers an excellent overview of the health of your SCOM deployments - showing you information about the top alerts, events, performance counters, discoveries and even state changes along with database space usage and grooming history.

IT Service Analytics from Approved

Another cool solution that Jonas and the guys have been working on is their new IT Service Analytics platform. This plug and play solution enables organisations to analyse their IT services being monitored with SCOM and then forecast potential issues – well before they occur. If you’ve deployed Service Manager (SCSM) or even Microsoft’s new Operations Management Suite (OMS), then the IT Service Analytics platform can pull data from any combination of SCOM, SCSM and OMS to give you an even deeper analysis of your IT estate.

Here’s an overview taken from their blog on how it works:

By optimizing and combining data from System Center Operations Manager, Microsoft OMS and System Center Service Manager into one holistic data model, you are able to put the IT service in focus. This allows you to extract, correlate and predict information about IT Service Management processes for things like event, capacity, availability, incident and change management.

We utilize most of the Microsoft Business Intelligence tools, such as SQL Server, SSIS, SSAS, R and SSRS. This allows our analytical platform to seamlessly blend with your System Center installation and tap software and hardware resources that are readily available.


Taking it for a Test Drive

Earlier this week I had a chance to take the IT Analytics platform for a test drive and my first impression is that it’s an awesome reporting tool to have in your locker to help with troubleshooting and predictive analysis.

From the home screen, you can choose from a wide range of pre-built reports with information about alerts, capacity management, events, configuration changes and IT service overviews to name just a few.


One of the reports I really like is the Services report. Clicking this tile from the main reports window brings me to the Service Overview shown in following image:


This report gives me a 30-day availability overview of all the IT services that I have modelled and monitored in my SCOM environment along with information about alerts, change tracking, capacity and predictive event risks.

Here’s a description of what the information in each of the report columns mean:

  • Goal – Has the SLA goal been met or not? IT Services that have met their SLA will be displayed as green instead of red (in this demo environment, I’ve sorted the column to display all SLA’s that haven’t been met).
  • Service – The name of the IT service.
  • Availability – Displays the last 12 months of the IT service availability.
  • Percentage – The SLA percentage that has been reached. The upwards arrow means that the SLA has reached a better result than the previous month.
  • Failures – The number of outages for the service during this period.
  • Downtime – Displays the number of minutes the service has been unavailable for the month.
  • Alerts – The number of alerts that have been generated by the service during this defined report period. The arrow shows decreasing or increasing compared to last month.
  • Events – The number of events that have been generated by the service during this period. The arrow shows decreasing or increasing compared to last month.
  • Change Tracking – The amount of changes made to servers or other components of the service.
  • Capacity Risks – Shows if there are risks with capacity, such as a server running out of free memory based on the usage.
  • Event Risks – Shows if there are any predicted events for the service.

Identifying Bottlenecks

When I drill into a particular IT Service from the Service Overview report, I get a more targeted Service Details report with a number of informational tiles and a Top N view of common KPI’s like % CPU, % Memory and % Disk Space used.

The Bottlenecks tile sparked my interest here so I clicked this one first…


This brought me deeper to the following view – where I could see that two of my servers in this IT service were displaying potential bottlenecks.


Clicking into the server with two potential bottlenecks identified, I was then presented with a performance chart that showed a very high percentage of bandwidth used on a new network adapter we recently installed into the server to support DPM backups. The performance chart also confirms for me that although my network adapter spiked on and off for the past few days (no doubt when backup jobs are running), the overall average performance of it seems fine and it’s projected to stay around the 10% utilisation mark for the next few months.


The other potential bottleneck that was identified relates to the % Free Disk Space of a logical disk on the Hyper-V server. I can see from the chart that in the past year, the free disk space on this logical disk has fluctuated from approx. 30% free to a minimum value of less than 1%. The chart looks ahead a few months and predicts that the best I can hope for (assuming I leave things as they are) is no more than 7% free disk space.


Predictive Alerts

Back at the Service Details report, I can click the Events tile shown in the image below to give me an Events Report with a heads-up on the forecasted events and alerts that are likely to occur in my environment within the next 24 hours.


All Alert and Event reports have built-in filters for every chart to give you a more scoped analysis view of what's going on. From the Event Report shown in the image below, I can see there are some predicted alerts and events that I need to pay attention to.


Drilling further into the predicted alert value for a particular monitored object, I’m presented with a ‘IIS 8 Web Server is unavailable’ alert that´s been predicted and the amount of times it has happened over the last month. I can see the time of day the alerts usually show up. In this example, these alerts typically occur around 6am every day.


If I go back to the previous view and click into the Events tile, I can see it’s broken down into three sections.

The first section is a summary where you can see information on the top hosts, data channels, rules, management packs etc. which are generating the most events. In the image below, we can see that the server generating the most events is SEGOTSQL01. The grey bar in the middle displays last month´s value. You can also see that this server alone has generated 88% of all events for the current period.


The middle section of this report displays the time and day of the week that the events are generated.


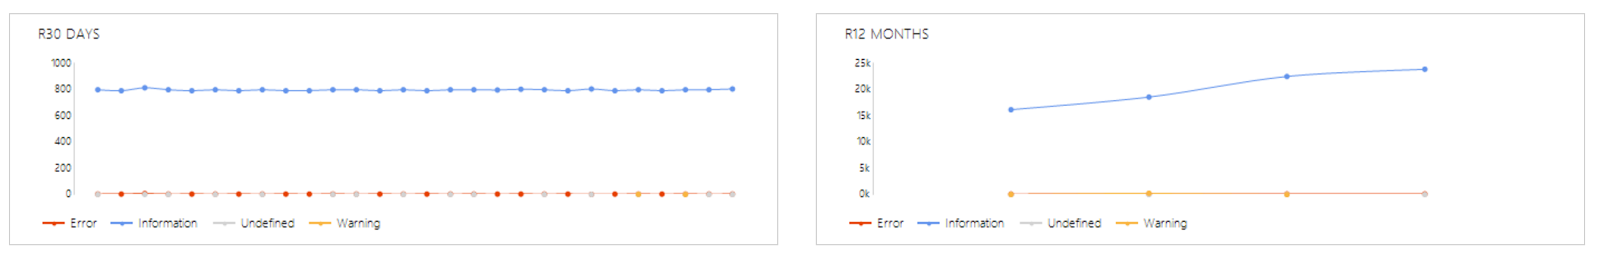
The final section of this report gives us an insight into both the last 30 days and the last 12 months for how events are being generated.


Custom Reports

It's easy to create your own custom reports and you can export them to PowerBi or Microsoft Excel in a matter of minutes. Here's a nice example of one-such custom exported report...


Licensing

I mentioned earlier that I love free solutions for SCOM and when I quizzed Jonas on how much this awesome offering costs to license, I was delighted to hear that Approved have decided to release it for free! They do require a one-off nominal setup and training fee but aside from that, there's no other limitations on the platform.

Summary

If you're interested in deploying these free solutions into your SCOM environment, then use the contact info here to get in touch with the team at Approved. For more information on the IT Analytics platform, take a read of some blog posts written by well known SCOM community blogger Daniel Ă–rneling here and here.


Tuesday, November 29, 2016

The Most Useful SCOM Article on the Web Just Got an Update!

As anyone who's ever worked with SCOM will know, it's a fairly heavy and complex product to get your head around at first and the larger the environment to be monitored, the more administration and troubleshooting tasks you'll need to teach yourself.


Way back when I started working with SCOM, I quickly found myself lost in a myriad of blog posts and TechNet articles searching for help on how to extract information from the SQL databases to help me better understand the problems I was experiencing.

The one thing that kept coming up trumps for me in my searches time and time again was Kevin Holman's 'Useful Operations Manager 2007 SQL Queries' post. This post brought together a virtual treasure chest of SQL queries that the 'non-SQL admin' like me could easily copy and paste into my SQL Management Studio window for instant information or configuration changes in my customers SCOM environments.

It was probably the first SCOM reference on the web that I saved as a favourite into my web browser and was always a location that I'd tell new SCOM admins to go check out and bookmark.

As the title of Kevin's post suggests, it was originally put together nine years ago as a central repository of SQL queries for SCOM 2007. When System Center 2012 and ultimately 2016 came around, these queries still worked with the newer releases of SCOM but there was often some confusion from people trying to understand if they only worked with SCOM 2007.

So to address this, just recently Kevin took the time to archive his original 2007-named post and create a new one titled simply 'SCOM SQL Queries'.


Not only has he renamed the post but he has also formatted it in a way that all queries are now much easier to read from and copy/paste as required.

Check out the new location for what is most likely, the most useful SCOM article on the web here:

https://blogs.technet.microsoft.com/kevinholman/2016/11/11/scom-sql-queries/


Friday, October 16, 2015

SCOM - New SQL 2012 & 2014 Management Packs with Bug Fixes Released

Yesterday I noticed that a new release (version 6.6.2.0) of the SQL 2012 & 2014 management packs has just landed and there's a lot of people out there who've been waiting on them.

Important Update - 21st October 2015: There have been a few reports about a bug in this latest management pack - which seems to have also been present in the previous MP release - where the SQL database logs on your DW server can fill up in certain scenarios. For this reason, it's a good idea to hold off deploying these MP's into production until Microsoft release a fix for this (as far as I know, Microsoft are aware of the issue and are working on a solution).

The previous release (version 6.6.0.0) brought a new dashboard template and visualizations....


Unfortunately, many people (myself included) that deployed this MP ran into problems when viewing the SQL Server Summary Dashboard. As you can see from the comments section at the end of this TechNet post - this was a widespread issue...


Thankfully, Microsoft have identified this as an issue and have listed this as a fix in the latest 6.6.2.0 release of the MP:


I've deployed this updated MP into my lab and so far, it seems to have fixed the issue for me - although it took a few days to manifest itself in the last MP so let's see how this one goes!

There's also a few new visualization options that you can choose from as you can see from Microsoft's post on the new MP's here.

You can download the new SQL management packs using the SCOM MP Wiki or directly from here (SQL 2012) and here (SQL 2014).

Note: As of the time of writing this post, these updated MP's are not available through the built-in catalog option in SCOM but I'd expect them to light up there in the coming days too.

Monday, July 13, 2015

Quickly Check Build Numbers for Common Microsoft Applications

If you ever have a problem trying to identify which version of your application its build number relates to, then I've got something pretty useful to help you out.


For the past year I've been referencing a community-authored blog that posts current build number references for common Microsoft applications and provides a download link to each cumulative update or service pack.

The list of applications that are referenced include System Center and SQL (definitely one you'll use a lot here). It's regularly updated (the new 2016 Tech Preview releases are all there) and goes back quite a few versions - MOM 2000 is even listed!

There's a handy navigation ribbon to choose your application or if you like, just use the tags.

Here's the blog URL:


Thursday, December 4, 2014

Performance Problems with your SCOM Console? This 'Might' Help....

My good friend Marnix has just blogged a very interesting post about a really slow performing SCOM console issue that he was having at one of his customer sites.

After a lot of searching to try and resolve the issue, he came across some information about editing the default 'Max Degree of Parallelism' setting inside the SQL instance that was hosting the SCOM databases. When he modified this SQL setting, the difference in performance of the SCOM console was HUGE! He even had staff at the customer site come up to him to see what he had changed because the difference in performance was so noticeable!


Now halt for just a second!

Before you rush off and go back to all your slow performing consoles and change the 'Max Degree of Parallelism' setting on every SQL server that your customers run SCOM on, just take note of some interesting points that Marnix and a few other SCOM 'enthusiasts' (i.e. MVP's and Microsoft staff) have been having offline about this topic in the last day or so....

  • Some MVP's modified this setting and encountered performance gains.
  • Other MVP's made the change and saw either no difference, or even a drop in performance of the SCOM console.
  • A very well respected Microsoft employee working in the SCOM space also chipped in with his thoughts and made some interesting observations about how modifying 'Max Degree of Parrallelism' in the same way that each MVP saw gains in their console performance SHOULD NOT make any difference whatsoever!
  • Another point was also made that, modifying this setting 'MIGHT' help with performance when using HyperThreading on VMware with CPU Gang Scheduling.

So, taking all these points into account, my recommendation is to have a good read of Marnix' post here...

http://thoughtsonopsmgr.blogspot.ie/2014/12/scom-2012x-console-on-steroids-try-mdop.html

Then make your own judgement call on whether or not you modify the setting.

My view on this is that if you're already having bad SCOM console performance issues, then you've got nothing to lose by first bench-marking how long it takes you to open the console and perform certain tasks, then making the change to SQL and comparing the new performance load times with their originals. If you see much of a difference for the better, then you could be on to a winner - if not, then just change the setting back to it's default value of '0' and you're back to where you started with no harm done!


Thursday, February 6, 2014

E-Book Gallery for Microsoft Technologies - Your One Stop Shop!

I've just seen a tweet from Microsoft's Yung Chou about a relatively unknown TechNet Wiki page titled the 'E-Book Gallery for Microsoft Technologies'.


This Wiki page has easily over 100 different E-Books covering technologies such as Lync, SharePoint, SQL, System Center, Visual Studio, Azure (the list goes on and on) and there's also a diverse number of e-books in languages other than English.


The best thing about all these e-books is of course that they're all FREE!
 
I highly recommend you check out this excellent resource and get the downloads going for as many of them as you need to keep in touch with the growing number of different technologies that Microsoft has to offer.

Check out the Wiki here:

http://social.technet.microsoft.com/wiki/contents/articles/11608.e-book-gallery-for-microsoft-technologies.aspx

Enjoy :)

Wednesday, December 11, 2013

SCOM 2012 R2 - Deploying Highly Available Solutions on Windows Server & SQL 2012

My good friend and fellow Irish CDM MVP Paul Keely has just published a new whitepaper that outlines how to deploy SCOM 2012 R2 in a highly available (HA) configuration using Windows Server 2012 and SQL 2012.


The paper comprises 18 pages of different HA scenarios using these technologies and is a great read for anyone either about to embark on a new SCOM HA deployment or someone who's just thinking about a new customer design that delivers the contingency of uptime that has come to be expected these days.

Here's Paul's own description of it:

This guide covers the options available for deploying SCOM in a HA configuration using Microsoft technologies. We start off with a base SCOM design, and then go through clustering, SQL AlwaysOn, Stretched Clusters and Hyper-V replica.  This is an overview guide for all the options.


You can download the guide directly from TechNet here:

http://gallery.technet.microsoft.com/SCOM-2012-R2-HA-options-540beb95

Thanks Paul!

Sunday, September 8, 2013

SCOM - New SQL Management Pack and Summary Dashboard Released

Microsoft has just released a new management pack update for monitoring SQL. We first got a preview of this management pack at the Microsoft Management Summit (MMS 2013) in Las Vegas during the Workloads: Managing Windows, IIS & SQL Technologies session and since then, we've been waiting in earnest for it's release - mainly because of the new SQL Server 2012 Summary dashboard that comes bundled with it.

The release of this MP is a bonus for me as it's just in time for me to be able to include it into my demo for my upcoming session at System Center Universe 2013 DACH.

Here's a screenshot of what the new dashboard looks like (keep in mind that this dashboard will only run on SQL 2012 databases):


The new MP comes with some additional monitors, rules and all round improvements - here's a list of them taken directly from the MP guide:

  • Collect DB Active Requests count
  • Collect DB Active Sessions count
  • Collect DB Active Transactions count
  • Collect DB Engine Thread count
  • Thread Count monitor
  • Transaction Log Free Space (%) monitor
  • Transaction Log Free Space (%) collection
  • Collect DB Engine CPU Utilization (%)
  • CPU Utilization (%) monitor for DB engine
  • Buffer Cache Hit Ratio monitor
  • Collect DB Engine Page Life Expectancy (s)
  • Page Life Expectancy monitor
  • Collect DB Disk Read Latency (ms)
  • Collect DB Disk Write Latency (ms)
  • Disk Read Latency monitor
  • Disk Write Latency monitor
  • Collect DB Transactions per second count
  • Collect DB Engine Average Wait Time (ms)
  • Average Wait Time monitor
  • Collect DB Engine Stolen Server Memory (MB)
  • Stolen Server Memory monitor
  • Collect DB Allocated Free Space (MB)
  • Collect DB Used Space (MB)
  • Collect DB Disk Free Space (MB)
  • SQL Re-Compilation monitor
  • SPN monitor improved
  • Support for special symbols in DB names.
  • Improved AlwaysOn seed discovery
  • Run As configuration changes to support Low privilege for SQL Server 2012 Cluster
  • Improved performance of AlwaysOn discovery
  • Custom User Policy Discovery and Monitoring performance optimization
  • Hid AG health object from Diagram view
You can download the MP and its associated guide from here:

http://www.microsoft.com/en-us/download/details.aspx?id=10631

As always, make sure you read the guide from front to back (this is a big one!) and test the MP out first before deploying into production.

Monday, June 24, 2013

SCOM 2012 SP1 Install Error with SQL 2012 SP1 CU4 (KB2833645)

I'm back in action this week with another SCOM project and have come across an issue when deploying a new SCOM 2012 SP1 environment onto a new SQL 2012 SP1 server with the latest Cumulative Update 4 (KB2833645) deployed to it.

With CU4 installed on the SQL 2012 SP1 server, when you go to install your first SCOM 2012 SP1 management server and arrive at the "Configure the Operational Database" dialog box, after you input your server name and instance name (for where you want to deploy the OperationsManager database), you'll quickly see the following error and screenshot:

The installed version of SQL server is not supported. Verify that the computer and installed version of SQL server meet the minimum requirements for installation. Please see the supported configurations document for further information.


We know from the official documentation that SQL 2012 SP1 is fully supported so the easy fix here is to just uninstall Cumulative Update 4 (KB2833645) from your SQL 2012 SP1 server as shown below


Once this has been removed, you can then go back to your SCOM installation and carry on successfully.

Conclusion

My guess is that since SQL 2012 SP1 CU4 has only been released in the last few weeks, we'll need to wait until it's officially supported from the start of the SCOM installation phase to get around this error. In hindsight, it's my own fault in that I always want to have the latest updates deployed to my servers before I put them into production and I was probably a little over-zealous this time :)

Monday, June 3, 2013

TechEd North America 2013 Kicks Off Announcing Heaps of New MSFT Releases

Microsoft's flagship conference - TechEd 2013 - is kicking off today (June 3rd) in New Orleans. The Day 1 keynote speech by Microsoft's Brad Anderson is of particular interest due to the media storm that has been generated around the so-called Windows 'Blue' wave of updates across their client and server stack.


Here's a high-level summary of the keynote and announcements that have been made:

Windows 8.1

Microsoft announced the newest release of their client Operating System - called Windows 8.1. This release will be made available as a free upgrade to existing Windows 8 customers. The preview bits will be made available on June 26th and the final release will hit the shelves before the year is out.

The following Windows 8.1 features have been demonstrated or mentioned during the keynote:

  • Enhanced tile customization
  • Group policy management of the Start Screen
  • A new feature for Windows 8.1 and PowerPoint called Mirrorcast allows Windows 8.1 devices to easily pair with compatible streamless devices to allow seamless wireless presenting.
  • Workplace Join is a new feature that allows you to easily connect your non-domain joined device to the workplace and to just as easily remove all the customization and management of that device once you're finished working for the day.
  • Apps can be managed from the cloud with Windows Intune.

Windows Server 2012 R2

As the name suggests, Windows Server 2012 now has an updated release too. Here's what's been announced for it:
  • Work Folders is a new feature that should most likely see usage of applications such as Dropbox getting less and less use in the enterprise.
  • Active Directory on-premise now works with Azure Active Directory.
  • Storage spaces are taken to the next level with enhanced performance and scalability. With Storage Tiering, you'll get approx. a 16x improvement on Windows Server 2012 RTM.
  • Inbox VPN gateway for Network Virtualization


Hyper-V

Windows Server 2012 R2 Hyper-V has a number of significant enhancements, some of which are:

(Update - some of the info below has been added as features get mentioned in the breakout sessions)
  • Using DeDup storage with virtual machines can now enhance the performance of the virtual machines by intelligently caching the storage.
  • Live Migration compression now means that your virtual machines will migrate between hosts far quicker than with Windows Server 2012 RTM.
  • Using RDMA with Live Migration will enhance the live migration of your VM's even quicker than with the compression option.
  • Hyper-V replica can be managed across sites and with greater scale using the Hyper-V Recovery Manager feature of Windows Azure.
  • Remote Access via VMBus - this is seriously cool. It basically means we now get similar functionality to the HP ILO or Dell DRAC features with our virtual machines in Hyper-V.
  • Online grow and shrink of virtual hard disks to manage your virtual disk space allocations on the fly.
  • Replication of virtual machines can now be extended to a third site (as opposed to the two site limit in Windows Server 2012 RTM)

Windows Azure

Azure retains it original name but a plethora of new features have been added:

(Update - some of the info below has been added as features get mentioned in the breakout sessions)
  • Per minute billing
  • No charge for stopped virtual machines
  • Special rate for MSDN subscribers making dev/test scenarios much more feasible.
  • Uses the same Hyper-V hypervisor as in Windows Server 2012.
  • We can now see how much credit we've used directly inside the portal making it easier to keep the credit card bills down!
  • Azure Active Directory now works with Windows Server 2012 on-premise Active Directory
  • The Windows Azure Pack (WAP) has been announced. This is the new name for the Windows Azure Services for Windows Server (aka project Katal). Good whitepaper on this here (http://t.co/ahLGIn2zOQ)
  • Hyper-V Recovery Manager delivers enterprise level replication of your virtual machines between sites.

System Center 2012 R2

Like Windows Server, System Center 2012 now gets an 'R2' release. The only mention in the keynote of System Center was around Intune integrating with on-premise ConfigMgr to manage Windows 8.1 apps but this integration is nothing new. Hopefully as the week goes on, we'll get some additional feature updates on what's new.

(Update - some of the info below has been added as features get mentioned in the breakout sessions)
  • Built-in service template for Windows Server 2012 R2 Gateway functionality as part of SCVMM 2012 R2.
  • New Java Application Performance Monitoring (APM) functionality in SCOM 2012 R2


Application Lifecycle Management (ALM)

Here's what's coming for all you developers out there:
  • Team Foundation Server (TFS) and Visual Studio are getting new releases this coming year.
  • Microsoft has acquired a company called 'InRelease' that delivers integrated release management into TFS.
  • Enhanced load-test service will be delivered from the cloud.

SQL 2014

SQL has been given a new release too and we should see some preview releases towards the end of the year. Here's some of the new features:
  • New enterprise-level data insights with Excel project GeoFlow
  • Data Explorer helps to make use of big-data and translate it into tangible business use
  • Transaction processing now comes 'in-memory'

Summary

That just about wraps up all I could gather from the keynote without reviewing the recording again later but I think it'll give people the general feel of what's been announced.

You can check out the keynote video and a few selected live sessions at TechEd NA on Microsoft's Channel 9 website here: http://channel9.msdn.com/

Also, if you're looking for up-to-the-minute updates from some of the best sessions on the 'Modern Datacenter' track over there, then check out Aidan Finn's blog here: http://www.aidanfinn.com/

I think it's fair to say now that if you're working in the IT space, there's some pretty exciting times ahead for us :)

Wednesday, January 23, 2013

Free SQL Server guide for System Center 2012

A good friend of mine and fellow Irish System Center MVP Paul Keely has taken the time to write up an excellent guide on SQL 2008 R2 and System Center that will help you make design decisions for your deployments.

From the description:

This is a guide to help you make design decisions and maintenance plans for SQL Server 2008 R2 to support System Center 2012.  In the guide you will learn to make server and instance specific changes to support SQL server for the different workloads that System Center requires. We will look at the install requirements per product, what we need to move the data bases and how we should back them up.

Paul has made this guide available on the Microsoft TechNet site and it can be downloaded from here:

http://gallery.technet.microsoft.com/SQL-Server-guide-for-8584c403

He will be refreshing this guide to take into account SQL Server 2012 with System Center in the near future but until then, I'd highly recommend that you take advantage of yet another excellent FREE resource that the System Center community has made available to you and download this today!

Thursday, November 3, 2011

Notes from the Field: Installing SCOM 2007 R2 Databases into SQL 2008 R2 Part 2

In Part 1 of this short series, I walked through the manual installation of the SCOM databases using the DBCreateWizard.exe utility and also highlighted some of the issues that you will encounter when creating large SCOM databases manually with SQL 2008 R2.

In this post I will walk through the process of increasing the SCOM database and log files manually using SQL Server Management Studio and will also go through the pitfalls encountered when installing SCOM Reporting into and SQL 2008 R2 SSRS instance.

First up, we need to now increase the database and log sizes of the SCOM OperationsManager and OperationsMangerDW databases that we created earlier.

To do this open up your SQL Server Management Studio and right mouse click on the OperationsManagerDW database and then click ‘Properties’ from the drop down menu


No go to the ‘Files’ menu from the left hand side of the screen and you should see the MOM_DATA and MOM_LOG values for the database. The MOM_DATA value is the size of the database and the MOM_LOG value is the size of the log for that database. Firstly change the MOM_DATA value to the size that you want your OperationsManagerDW database to be in Megabytes – I’ve chosen 102400 for a 100GB data warehouse


Once the database sizing is complete, go back into the data warehouse properties and modify the MOM_LOG value to reflect your new log size


Repeat this process with your ‘OperationsManager’ database and modify the size of the DB and Log files to the required amounts.

Once you have your SCOM databases the correct size you can then go ahead and begin installing the SCOM RMS role (this is automatically assigned to the first server you build in a SCOM Management Group).

When you run the installer from the SCOM media on your SCOM RMS, you will need to be careful about what components you choose to install. You will need to ensure that you are not installing the ‘Database’ role as this has already been created using the ‘DBCreateWizard’ utility.

You need to de-select this role like the screen below


Carry on through the rest of the SCOM installation as normal and once it finishes, you should have your first SCOM server installed and connected to your SQL 2008 R2 ‘OperationsManager’ database.
The final hurdle that you will meet when installing SCOM onto an SQL 2008 R2 instance is when you go about installing the SCOM Reporting component. The reporting module uses the ‘OperationsManagerDW’ data warehouse database and has dependencies on SQL 2008 R2 Reporting Services.

On the SQL 2008 R2 server with the Reporting Services instance installed, run the SCOM installation media and select the ‘Install Operations Manager 2007 R2 Reporting’ option

Work through the wizard and again de-select the database option – in this case the ‘Data Warehouse


When you have inputted in your Root Management Server name and specified the SQL server and instance that the Data Warehouse database is located, you will be presented with the ‘SQL Server Reporting Services Instance’ window from which you need to select your SSRS instance and click ‘Next’………


It’s at this point however that your SCOM Reporting installation will hang and look like it has become unresponsive. I have seen this screen hang like this for sometimes 30 minutes without doing anything!! Very frustrating!

The fix is quite simple though and it’s related to a local user group that gets created on the SQL server when the SQL 2008 R2 Reporting Services (SSRS) role is installed.

To resolve the problem, on the SQL 2008 R2 SSRS server, click ‘Start’, then ‘Run’ on your server and then type ‘lusrmgr.msc’ and click ‘OK’ to open the ‘Local Users and Groups’ snapin


Once this opens, click on the ‘Groups’ folder and expand the ‘Name’ column out so you can see the full name of each group as below


You will notice that one of the groups is titled

‘SQLServerReportServerUser$SQLSERVERNAME$MSRS10_50.SSRSINSTANCENAME

If you right click on this group and remove the _50 characters from the name so it instead shows

‘SQLServerReportServerUser$SQLSERVERNAME$MSRS10.SSRSINSTANCENAME

You should then see a window opening up immediately from your hung SCOM Reporting install that looks something like this


If you see the window above, then all that’s left to do is to fill in the fields requested and work through the wizard and that will be your SCOM Reporting configured successfully!

If the above window doesn’t open for you and instead you see the window below immediately after renaming the SQL Local Group, then you need to carry out some more simple tasks before you're done.


When you see the Window above with an error message of:

'SQL Reporting Services Validation Error'

'Setup has encountered an error while installing Reporting'

then click the ‘Back’ button to go back one screen

Now open up the SQL ‘Reporting Services Configuration Manager’ from your start menu and ensure that you have a database specified. If this is the first time you’ve seen this configuration window, then you just need to run through each of the options on the left hand side and select default settings for each menu to complete the configuration (these options will be overwritten by the SCOM Reporting Installer). The main reason you get the error message from the SCOM Reporting installation above is because your SSRS instance hasn't been fully configured and most likely there is no reporting database or website specified.


Once you have configured your reporting services with default settings, exit the configuration wizard and then go back to your SCOM Reporting installation and click ‘Next’ again (or if you've closed out of it, just re-run the SCOM Reporting installation again). This time you should see the screen below allowing you to continue.

Once you see this screen, then you’re only a few clicks away from successfully completing your SCOM Reporting Services installation with SQL 2008 R2!!

Notes from the Field: Installing SCOM 2007 R2 Databases into SQL 2008 R2 Part 1

This is a blog post that I’ve been meaning to put up for nearly a year but kept forgetting to document the process during SCOM installs – until now!

There are a couple of issues when you are installing SCOM 2007 R2 into an SQL 2008 R2 environment that can be quite annoying and the fix isn’t that obvious at first glance for them. The issues occur when the DBCreateWizard.exe hangs or crashes and the SCOM Reporting installation hangs half way through too.

When you try to install the SCOM databases into an SQL 2008 R2 environment using the standard SCOM installation process, you will soon see that it fails on the pre-requisite check for SQL server and will report back that you don’t have SQL Server installed as the image below shows!


Because the SCOM 2007 R2 media is not SQL 2008 R2 aware, you need to manually create the SCOM ‘Operations Manager’ and ‘OperationsManagerDW’ databases using the ‘DBCreateWizard.exe’ utility.

Before creating the SCOM databases, it’s always a good idea to know what size you will want your databases to grow to, I always use the OpsMgr Sizing Tool v1.3 as a guideline to sizing and you can download it from here:

http://www.microsoft.com/download/en/details.aspx?displaylang=en&id=23016

To manually create the SCOM databases in your SQL 2008 R2 environment you first need to copy the SCOM media (or at least the ‘Support Tools’ folder from the media) to your SQL 2008 R2 server.

Note: Make sure that you have already created a new SQL instance for the SCOM databases with an SQL Collation setting of :

‘SQL_LATIN1_GENERAL_CP_CI_AS’ ( no other SQL collation will do for your SCOM install!)

Now open a command prompt with administrator privileges, browse to the SCOM media location and open up the \SupportTools\AMD64 folder


 Now run the 'DBCreateWizard.exe' utility


 Once the Database Configuration Wizard opens, click on 'Next' to continue 


From the next screen, choose which database you will be installing, select your SQL instance, specify the size of the database and ensure you have your database and log file locations correct, then click ‘Next’ to continue


Next up, choose a name for your SCOM Management Group and specify what administrative groups have access to the SCOM console


Choose whether or not you want to send your Error reports to Microsoft and then click ‘Next’ again


 Confirm all is good in the final screen, then click ‘Finish’ to build the first ‘OperationsManager’ database


All going well and you should see the screen below confirming that the Database installation was successful


So, what was the problem with that you might ask? So far, nothing! All goes well with this first ‘OperationsManager’ Database installation but you will start to run into problems when installing the ‘OperationsManagerDW’ database component on an SQL 2008 R2 server.

To begin installing the ‘OperationsManagerDW’ database, you will follow nearly identical steps to the ones above for the ‘OperationsManager’ database.

To kick it off, again run the ‘DBCreateWizard.exe’ utility from an administrative command line


Once the Database Configuration Wizard window opens, click 'Next' to continue


From the next screen, choose the ‘Operations Manager Data Warehouse Database’ option from the drop down menu, select your SQL instance, specify the size of the database and ensure you have your database and log file locations correct, then click ‘Next’ to continue


Confirm all of your settings are correct and then click ‘Finish’ to install the Data Warehouse DB


Now, after a short while, if you’ve selected to install a database that is any size larger than around 40GB (in my example above, I’ve chosen to create a 100GB one), you will get a timeout error back from your SQL server stating:

‘Database creation failed. The database might have been incompletely created or modified.’


The trick here is to create the database using the DBCreateWizard utility but don’t specify a size greater than 40960MB (40GB). Once this 40GB Data Warehouse completes successfully, then we have to go into the SQL Server Management Studio and increase the size of the databases from there. We will also need to increase the size of the log files for each database at this point too.

In Part 2 of this short 'Notes from the Field' series, I'll continue on with manually expanding the SCOM databases using the SQL Server Management Studio and will also walk through the SCOM Reporting installation and the issues that can arise when installing it into an SQL 2008 R2 SSRS environment.