Wednesday, July 27, 2011

SCOM - Installing the HP Proliant Server Management Pack Step by Step

The purpose of this post is to walk you through the installation and configuration of the HP Proliant Server Management Pack into System Center Operations Manager 2007 R2 (SCOM). There are a few gotcha's that I've come across on customer sites in the past that are mainly attributed to the HP servers either not having the HP Insight Management agents installed, not having the SNMP service installed or just a misconfiguration of the SNMP service.

To begin, download the HP Proliant Server Management Pack for System Center Operations Manager 20087 from the link below:

http://h18000.www1.hp.com/products/servers/management/mom2007/index.html?aoid=35252

When you have downloaded the files, extract them to a folder on your SCOM RMS server and then run the MSI installer to add the HP Proliant Server Management Pack into SCOM. When it completes successfully, you should be able to see the 'Hewlett-Packard Proliant Servers Base', 'Hewlett-Packard Proliant Servers SNMP Management Pack' and the 'Hewlett-Packard Proliant Servers WMI Management Pack' available as shown in the screen below.


The next step that you need to take is to either wait the default 60 minutes for discovery of your HP Proliant Servers, or you can create an override on the discovery to change it to something quicker so you can start working on what SCOM finds in relation to the HP Proliant Server Management Pack. The screenshots below show how to create the override within SCOM to change the discovery time for the 'HP Proliant Server Discovery' rule.


Once the discovery is complete, you should see your HP Proliant servers listed in the 'Server State' view under the 'HP Servers' Management Pack from within the Monitoring tab in SCOM as below.


If all of your HP Proliant Servers are shown in the 'Server State' window above, then that completes the installation of the HP Proliant Servers Management Pack and you will now see alerts coming into SCOM that are read directly from the HP Insight Management agents installed on each HP Proliant Server.

If you do not see all or any of your HP Proliant Servers in the 'Server State' window as above, then the first thing you need to do is to logon locally to the server that is missing and open the 'HP Systems Management Homepage'. The chances are when this page opens, it will have no information on the server in question and come back with a blank screen like the one in the screenshot below.


The reason for the 'HP System Management Homepage' coming back blank is down to a number of factors based around SNMP and the HP Insight Agents. The first to to do is to run the latest HP Proliant Support Pack (PSP) for the model of server you are working on. When you run the HP PSP check for the 'HP Insight Management Agents' and the 'HP Insight Management WBEM Providers for Windows Server 2003/2008 Editions' and it is quite possible that they hadn't been installed or updated the last time the PSP was run on that server.

Just select the radio box next to the Insight Management Agents to install them (see screenshot below)and run the installer from the HP Smart Update Manager to complete the process.

Note: If you need to install the HP Insight Management Agents, your server will need to be rebooted so ensure that you prepare for this before running the installer.


Next up, if you haven't already installed the SNMP service onto your HP Proliant Server, now would be a good time to do it as the 'HP System Management Homepage' depends on the SNMP service to get its information on the hardware. If you are using Windows Server 2008

Once you have the SNMP services installed, open the 'services.msc' snap-in and locate the 'SNMP Service' and double click on it to open up its properties.

When you have the SNMP service properties page open, you need to now enter a community name (such as public for example) into the field below, then click 'Add to List' to add it to the community string list. You also need to enter a trap destination (use the loopback address here) as shown below.


Now click on the 'Security' tab of the SNMP Service properties and configure your settings similar to the window below ensuring you enter the same community name as you created in the last step.

Add your SCOM Management server IP addresses to the 'Accept SNMP packets from these hosts' field and also leave the 'localhost' option in here too. Click 'Apply' now to close the SNMP Service properties.


Once you have finished modifying the SNMP Service Properties, restart the SNMP service. If all is going to plan, then this should also prompt you that it will restart the HP Insight Management Agent services too. If it doesn't prompt you that this is going to happen, then you need to revisit the steps in this post from above on installing the HP Insight Management Agents using the HP Proliant Support Pack (PSP).


When all the SNMP and HP Insight Management Agent Services restart, you should now be able to open the HP Systems Management Homepage to see that all of the system information is now populated like the example in the window below.


Once the HP System Management Homepage is populated with data relevant to the HP Proliant Server you are working on, then the HP Proliant Server Management Pack discovery rules will find your Proliant server and enable monitoring of it from within SCOM.

Tuesday, July 26, 2011

SCOM- Could Not Determine the FSMO Role Holder

Update June 2012: I've just recently came across a cool workaround blog post on this issue by Stefan Roth that requires a change to each Domain Controller you are managing that creates a symbolic link that would allow this task to be run each time. Check out his post below:

http://blog.scomfaq.ch/2011/12/04/support-tools-task-in-active-directory-management-pack-fails/

When you install the Active Directory (AD) Monitoring Management Pack into your SCOM/OpsMgr environment, from time to time you will come across the error 'Could Not Determine the FSMO Role Holder', followed quickly by the errror 'AD Client Side - Script Based Test Failed to Complete'.


This is an annoying little error that has a relatively easy fix.

Cameron Fuller and the guys behind the 'System Center Operations Manager Unleashed' series have a good post on their blog containing a lot of resolutions to these type of errors generated from the Active Directory Management Pack - see the link below:

http://opsmgrunleashed.wordpress.com/2009/09/29/opsmgr-r2-by-example-the-active-directory-management-pack/

Following the information from the blog post above, we would select the 'Netdom Query FSMO' task on the right hand side of the screen when you have the 'Could Not Determine the FSMO Role Holder' alert highlighted


 This will open a window like the one below. Have a look at the location of the 'Support Tools Install Dir' Value. It is pointing to the '%ProgramFiles%\Support Tools' location


 When we run the task without changing anything, it will come back and fail with an error like below


The reason it fails is because the NetDom utility doesn't exist on the Domain Controller that is raising the alert in the %ProgramFiles%\Support Tools location. It is existent in the '%windir%\system32' location instead. If we choose to re-run the task but this time select the 'Override' button and modify the 'Support Tools Install Dir' value to point to the correct location of the NetDom utility, it will complete successfully as the screens below show.


Most of the time, simply by carrying out the above procedure, this error will go away as the FSMO role holder has been enumerated but in a few instances, we need to make one or two more small changes.

If the alert comes back after the above process, all you need to do is to locate the 'NetDom' utility from within the %windir%\System32 directory, create a new folder under the 'Program Files' folder on the Domain Controller giving the error called 'Support Tools' and then copy the 'NetDom' utility to here like the screenshot below


Now you can run the task again successfully without having to make any overrides or custom changes to your SCOM environment.


Hopefully after these changes, the rule should be able to run the NetDom utility and determine the FSMO role holder of each domain controller.

Thursday, July 7, 2011

Check your SQL Server Builds and Service Pack Levels

Here's a really handy little blog for checking the SQL server build and service pack level for your installations.

I am often running into isues when trying to install SCOM reporting onto an SSRS server and it fails the pre-requisites because it is missing a service pack and I find this website has all the information to allow me to quickly identify the different versions including ones that have been modified with hotfixes too!

http://sqlserverbuilds.blogspot.com/

Tuesday, July 5, 2011

SCOM Dashboards - Conclusion and References

Before reading this post, please ensure you have reviewed my previous posts on SCOM Dashboarding from the links below:

SCOM Dashboards - The Intro
SCOM Dashboards - Part 1 - Installing WSS 3.0
SCOM Dashboards - Part 2 - Installing the Dashboard Solution Accelerator
SCOM Dashboards - Part 3 - Customizing the Dashboard Banner and Logo
SCOM Dashboards - Part 4 - Customizing the Dashboard Tabs
SCOM Dashboards - Part 5 - Installing the Service Level Dashboard (SLD 2.0)
SCOM Dashboards - Part 6 - Adding SQL Queries to the Dashboards
SCOM Dashboards - Part 7 - The SCOM Distributed Application Health State Tab
SCOM Dashboards - Part 8 - Adding the SLD Tab to the SCOM Dashboard

I hope that if you are reading this post that it means you have taken the time to review the other posts in this series and have found the information in them useful. Although I haven't come across this solution on the web previously that offers a central tabbed dashboard that includes a SCOM Admin dashboard, a SCOM Distributed Application Health State dashboard and the SCOM Service Level Dashboard, it doesn't mean that I came up with the ideas for each component all by myself.

Below are some links to the other SCOM community member blog posts that made this particular series possible and I would like to thank them for their hard work and time put in to their posts as without them I wouldn't have been able to come up with this solution.


Kevin Holman (Credit for a huge amount of SQL queries and the best resource on the web for them)
http://blogs.technet.com/b/kevinholman/archive/2007/10/18/useful-operations-manager-2007-sql-queries.aspx

Cameron Fuller (Credit for SCSM dashboard customization)
http://blogs.catapultsystems.com/cfuller/archive/2010/12/11/using-the-service-manager-2010-dashboard-for-operations-manager.aspx

Tim McFadden (Credit for SCCM dashboard customization)
http://www.scom2k7.com/how-to-create-a-custom-scom-dashboard-to-show-key-management-group-information/

Steve Beaumont (Credit for Distributed Application Health State Dashboard)
http://systemscentre.blogspot.com/2011/04/system-center-dashboards-sccm-scom-sql.html

Anders Bengtsson (Credit for additional dashboard customization)
http://contoso.se/blog/?p=1409


Finally, the purpose of this blog series is to highlight the use of dashboard solutions for SCOM that are FREE and that haven't been blogged about much in the past. I have decided to omit the dashboard integration that can be used with Visio 2010 and Sharepoint 2010 as this has been blogged about all over the web and I didn't want to go over old ground again.

I have also omitted the excellent Savision LiveMaps dashboard solution as it is not free - contrary to what a lot of people think, Savision allow the use of 5 maps for free for 12 months, then you need to purchase a licence for them. If you do have the budget to spend and are looking for an extra dimension in SCOM dashboards, then Savision LiveMaps is the only way to go.

For more information on the Visio 2010, Sharepoint 2010 and Savision LiveMaps solutions, see the excellent blog series by SCOM MVP Marnix Wolf from the link below:

Marnix Wolf
http://thoughtsonopsmgr.blogspot.com/2010/09/scom-and-dashboards.html


That brings this series to an end, thanks for reading and hopefully you have found the information helpful.

SCOM Dashboards - Part 8 - Adding the SLD Tab to the SCOM Dashboard

Before reading this post, please ensure you have reviewed my previous posts on SCOM Dashboarding from the links below:

SCOM Dashboards - The Intro
SCOM Dashboards - Part 1 - Installing WSS 3.0
SCOM Dashboards - Part 2 - Installing the Dashboard Solution Accelerator
SCOM Dashboards - Part 3 - Customizing the Dashboard Banner and Logo
SCOM Dashboards - Part 4 - Customizing the Dashboard Tabs
SCOM Dashboards - Part 5 - Installing the Service Level Dashboard (SLD 2.0)
SCOM Dashboards - Part 6 - Adding SQL Queries to the Dashboards
SCOM Dashboards - Part 7 - The SCOM Distributed Application Health State Tab

The final piece of this jigsaw is to add the Service Level Dashboard Web Page as an active tab alongside the SCOM Dashboard and SCOM Distributed Applications Health State tabs

Open the SCOM Dashboard home page and click on 'Site Actions' on the left hand side, then select 'Site Settings' from the drop down menu


Now click on the 'Top Link Bar' link
From here, click on 'New Link'


Now copy the URL for the Service Level Dashboard web page into the field as shown and then click 'OK'


You now have an additional tab for your 'SCOM Service Level Dashboard' and when you click on the tab, it opens up your SLD page


When you open your SLD page, click on the 'Site Settings' option to add the SCOM Dashboard tabs to this webpage

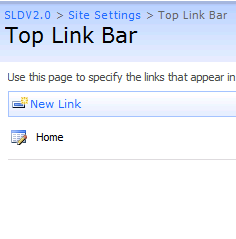
Again, in the 'Look and Feel' section, click on the 'Top Link Bar' to make the customisations. When you see the screen below, click on the icon beside 'Home' to edit the name of the Home tab.

Change the name of the 'Home' tab to something like 'SCOM Service Level Dashboard' as shown below, then click 'OK'


Now click on the 'New Link' button from the 'Top Link Bar' to create the other tabs for the SCOM dashboard


From the window below, copy the URL for your previously created 'SCOM Admin Dashboard' and type 'SCOM Admin Dashboard' into the description field as below, then click 'OK'


Now for the final time, click on the 'New Link' button again from the window below

This time, copy the URL for your previously created SCOM Distributed Applications Health State Dashboard into the web address field and type the description as shown below, then click 'OK'


Your top link bar from within the Service Level Dashboard site settings window should now look something like this


Click on the 'Change Order' button to move the order of the tabs around to reflect the same order that you have from within your SCOM Admin Dashboard to provide a seamless integration look to both dashboards. Once you are happy with the order of the tabs, click 'OK' to complete the tab editing


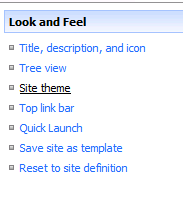
Now all that's left to do is to change the theme of the SCOM Service Level Dashboard to look similar to the other SCOM dashboards. We do this by clicking on 'Site Actions' on the right hand side and then selecting 'Site Settings' again. When this opens, click on 'Site Theme' from within the 'Look and Feel' column

I have used the default SCSM dashboard theme of 'Obsidian' for my other dashboards so I will again choose this for the SCOM Service Level Dashboard by highlighting it and then clicking on 'Apply'


Your final SCOM Service Level Dashboard with associated SCOM dashboard tabs should now look like this


This completes your configuration of the SCOM dashboard solution that incorporates a SCOM Admin Dashboard, SCOM Distributed Application Dashboard and a SCOM Service Level Dashboard as three separate tabs within one web browser view.

The final post of this series will summarise what we have achieved so far, will provide web links to sites that I have found very useful when working with dashboards in SCOM and will provide some of the SQL queries that I have used to create these web parts.

SCOM Dashboards - Part 7 - The SCOM Distributed Application Health State Tab

Before reading this post, please ensure you have reviewed my previous posts on SCOM Dashboarding from the links below:

SCOM Dashboards - The Intro
SCOM Dashboards - Part 1 - Installing WSS 3.0
SCOM Dashboards - Part 2 - Installing the Dashboard Solution Accelerator
SCOM Dashboards - Part 3 - Customizing the Dashboard Banner and Logo
SCOM Dashboards - Part 4 - Customizing the Dashboard Tabs
SCOM Dashboards - Part 5 - Installing the Service Level Dashboard (SLD 2.0)
SCOM Dashboards - Part 6 - Adding SQL Queries to the Dashboards

Next we are going to modify the 'SCOM Distributed Applications Health State' tab and provide a live view of the health state of all your DA's through the dashboard

Click on the 'Edit page' link as below to continue


Now we are going to remove all of the existing SCSM web parts simply by clicking on the 'X' beside each one until we get a screen that looks like this


Configure your Dataset exactly as shown below otherwise the DA health states and colours will be incorrect (the SQL query will be specific to your own site in relation to the DA names however and you can get the SQL query I used from Steve Beaumont's blog credited here)


The Score Card label and value information below is VERY IMPORTANT and needs to be exact!


Next up is to add a new web part to the horizontal bottom section of the screen as shown


Select the 'Microsoft Dashboard Viewer' option


Now from this newly created web part, click on the 'Edit' button, and then select 'Modify Shared Web Part' from the list


From the menu on the right hand side of the screen, select the 'DAHealthState' dataset that was configured earlier, and then click 'OK' to close the window

You should now have a tab that looks something like this


The penultimate Part 8 post of this SCOM Dashboard blog series will demonstrate how to create a new tab alongside your SCOM Dashboard and SCOM Distributed Application Health State Dashboard tabs that includes the Service Level Dashboard 2.0.

SCOM Dashboards - Part 6 - Adding SQL Queries to the Dashboards

Before reading this post, please ensure you have reviewed my previous posts on SCOM Dashboarding from the links below:

SCOM Dashboards - The Intro
SCOM Dashboards - Part 1 - Installing WSS 3.0
SCOM Dashboards - Part 2 - Installing the Dashboard Solution Accelerator
SCOM Dashboards - Part 3 - Customizing the Dashboard Banner and Logo
SCOM Dashboards - Part 4 - Customizing the Dashboard Tabs
SCOM Dashboards - Part 5 - Installing the Service Level Dashboard (SLD 2.0)

To customise your SCOM Dashboard and remove the pre-inserted SCSM web parts, follow the screens below:

Open your SCOM Dashboard and click on 'Edit Page' from the menu on the right hand side


Input in a new Dataset Configuration Name, add your SQL Server and instance name, add your OperationsManager database name and copy and paste your SQL query into the SQL Query window as below (SQL queries can be obtained from the list of community blog references in the final part of this series)


Select 'Parse Query' and then 'Validate Query' and ensure you get the green tick and preview data before continuing


Expand 'Charts', leave 'Pie' selected and then click 'Add' to create a Pie Chart with your SQL query information. Fill out the fields similar to the graphic below


Once this is completed, click on 'Save and Close' to complete the new SQL query injection

Now what you need to do is to add your new 'Top20AlertsbyRepeatCount.xml' file into an existing Web Part for display within your dashboard

Click on an the 'edit' button from within an existing web part on the dashboard and select 'Modify Shared Web Part'


This will open the web part for editing on the right hand side of the screen. From here, use the 'Select Data Set Configuration' button and highlight your previously created SQL query as below

 
Next, put an entry into the 'Title' field to give your new web part a name and then leave all of the other settings as they are and click on 'OK'

 
This should now replace the old SCSM web part on the dashboard with your new 'Top 20 Alerts by Repeat Count' dashboard as shown below


Repeat this process as many times as you like using different SQL queries and chart types and then changing the existing SCSM web parts one by one until you get the dashboard that you want for your business

If you want to remove any excess web parts and tidy up the dashboard a bit, then all you need to do is to select the 'X' in the corner beside the 'Edit' button to remove it completely

Your final SCOM Dashboard tab should look something like this:


With the SCOM dashboard itself finished now, in Part 7 I will describe how to create a scorecard web part that acts as a Distributed Application Health State dashboard.