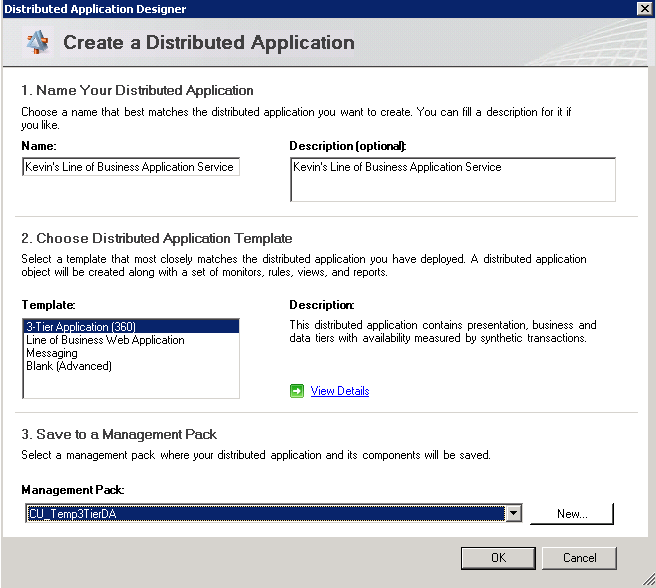
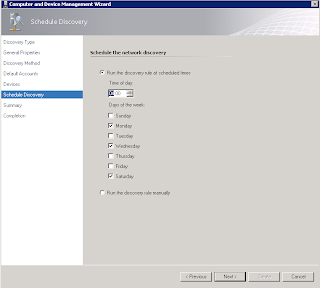
This post builds on the 'Web Application Transaction Monitoring' model in SCOM 2012 and demonstrates how to record a web browser session for times when you need to monitor web logins and user experience.
Update Oct 2016: If you've landed on this post and want to know how to get this feature working with later versions of Internet Explorer, then check out this post from Marnix Wolf to get you sorted.
I'll be using the System Center 2012 Private Cloud Community Evaluation Program (CEP) website as an example. If you're interested in learning more about System Center 2012, then you can sign up to the CEP at any time using the link below:
https://connect.microsoft.com/site799/program7383
First up, click on the 'Authoring' button from the SCOM 2012 console down the bottom left hand side of the screen, select the 'Web Application Transaction Monitoring' link on the left then click on the 'Record a browser session' link on the right hand side on the screen

In the 'Web Application Editor', enter a name and description and choose an unsealed management pack to save the monitor to

From the web application editor, click on the 'Start Capture' link.

Note: At this point an Internet Explorer window will open, but depending on the type of server or workstation you have installed the SCOM web console on, if it is a 64 Bit server or workstation (which most likely it is), then you will just get a blank Internet Explorer screen like the one below with no Web Recorder add-in present.

If you are presented with the blank Internet Explorer screen with no Web Recorder add-in as above, it is because the 64 Bit server has automatically opened the 32 Bit version of Internet Explorer which currently doesn't support the Web Recorder add-in.
To enable the Web Recorder add-in, we need to make a small change in the registry of the 64 Bit server. Open 'Regedit' and navigate to the following location:
HKEY_LOCAL_MACHINE\SOFTWARE\Microsoft\Windows\CurrentVersion\AppPaths\IEXPLORE.EXE

The registry keys on the left hand side of the screen above show that Internet Explorer will always run from the 32 Bit 'Program Files (x86)' location as opposed to the 64 Bit default 'Program Files' location.
We need to edit both of these values and remove the (x86) reference from each line as the screenshots below show


The newly edited registry keys should now look like this

Once this registry change is complete, simply go back to the Web Application Editor and then click on the 'Start Capture' link again
Now the 64 Bit version of Internet Explorer will open and on the left hand side of the screen, you will see the 'Web Recorder' add-in. Click on the 'Record' button and then browse to the website that you want to configure for monitoring within SCOM 2012

As you browse to the website that you are recording and login, you should see the Web Recorder screen on the left hand side fill up with the url references for each click that you make


When you are finished your browsing, click on the 'Stop' button from the Web Recorder screen on the left hand side to finish the recording and return to the SCOM Web Application Editor

The screen below now has all of the steps imported from the Web Recorder session under the Web Site - Requests screen. To assign a watcher node for this synthetic transaction, click on the 'Configure Settings' link on the left hand side of the screen

Click on the 'Watcher Node' tab of the Web Application Properties and then select the relevant server that you want to assign the task of running this test from and specify the frequency of the test here too. When complete, click on the 'OK' button to close the Web Application properties window

Now click on the 'Apply' button down the bottom of the screen to save your changes

When al changes have been saved successfully, you can close the Web Application Editor window

In the Authoring screen, you should now see your newly recorded browser session alongside any other web application monitors that you have created within SCOM 2012

To verify that your new recorded browser session monitor is working, go back to the 'Monitoring' tab in the SCOM console and expand the 'Web Application Transaction Monitoring' folder, then click on the 'Web Applications State' link to show the health state of your newly recorded web browser session

If you want to learn some more about System Center 2012, then click on any of the links below for some of my other previous posts:
Cloud Management with System Center - Building a Private Cloud with System Center Virtual Machine Manager 2012
Cloud Management with System Center - Creating a Virtual Machine Template with System Center Virtual Machine Manager 2012
Cloud Management with System Center - Creating a Service Template with System Center Virtual Machine Manager 2012
Cloud Management with System Center - Connecting your private cloud to System Center App Controller 2012
Cloud Management with System Center - Customizing System Center App Controller 2012
Cloud Management with System Center - Connecting App Controller to Azure Part 1
Cloud Management with System Center - Connecting App Controller to Azure Part 2
Cloud Management with System Center - Integrating App Controller with SCOM