Tuesday, July 5, 2011

SCOM Dashboards - Part 4- Customizing the Dashboard Tabs

Before reading this post, please ensure you have reviewed my previous posts on SCOM Dashboarding from the links below:

SCOM Dashboards - The Intro
SCOM Dashboards - Part 1 - Installing WSS 3.0
SCOM Dashboards - Part 2 - Installing the Dashboard Solution Accelerator
SCOM Dashboards - Part 3 - Customizing the Dashboard Banner and Logo

From your newly modified 'SCOM Dashboard' home screen, click on the 'Site Settings' option again to start modifying the three 'Incident', 'Activity' and 'Change' tabs at the top of the screen


In 'Look and Feel' again, select the option for the 'Top Link Bar'

Now click with your mouse on the icon beside the first 'Incident' option to edit the link properties


Change the name of the tab as below and then click on 'OK'


Repeat the process again for the 'Activity' tab but change it to 'SCOM Distributed Application Health State Dashboard' and then click on 'OK'


For the final tab, instead of renaming this one, open it up and then select the 'Delete' button (we will be replacing this tab later on with something far more interesting!) and then click 'OK' to confirm


Your dashboard should now look something like this so far with the logo, name reference and tabs all now relative to SCOM


Click on the 'SCOM Distributed Application Health State' tab that was created from the previous post


Once you have this tab open, click on the 'Site Actions' and then 'Settings' option on the right hand side


What we want to achieve at this point is a modification of the actual URL that this tab points to so that it no longer references the 'Activity' tab we removed previously


From this window, as before, click on the 'Title, Description and icon' option

Now change the 'Title', 'URL' and 'URL Name' from the following window to rename title, select your new SCOM_Logo.png file and generate a new url to browse directly to


Once completed, your new 'SCOM Distributed Application Health State Dashboard' tab should look something like this


In Part 5 of this series, I will walk through the installation of the Service Level Dashboard 2.0.

SCOM Dashboards - Part 3 - Customizing the Dashboard Banner and Logo

Before reading this post, please ensure you have reviewed my previous posts on SCOM Dashboarding from the links below:

SCOM Dashboards - The Intro
SCOM Dashboards - Part 1 - Installing WSS 3.0
SCOM Dashboards - Part 2 - Installing the Dashboard Solution Accelerator

In this post, I will walk you through customizing the SCSM solution accelerator dashboard, removing all references to System Center Service Manager and giving it the look and feel of a SCOM dashboard.

Open the SCSM dashboard from the URL that was created during installation in my last post and select the 'Site Actions' button on the right hand side of the screen, then click 'Site Settings'


From the 'Users and Permissions' section, click on 'People and Groups' to configure what users will have access to the SCOM dashboard


Select the 'New Group' dropdown option to create your new group


Input in the new name for your SCOM Dashboard Admin Group and ensure you select 'Full Control' permissions as below


Select the 'Add Users' option to add users to your newly created Dashboard Admin Group


Select all of the users and groups that you want to add to your new SCOM Dashboard Admin Users group and then click on 'OK'


Once this has been completed, you need to go back to the 'Site Settings' screen again from the Dashboard Home Page to begin removing the SCSM references


At this point, you want to modify the Look and Feel of the website and replace all references to SCSM with SCOM. To do this, you need to click on the option below

From here, you can edit the Title of the window to remove the 'Incident Management Dashboard' text from the top and replace it with something like 'SCOM Dashboard'


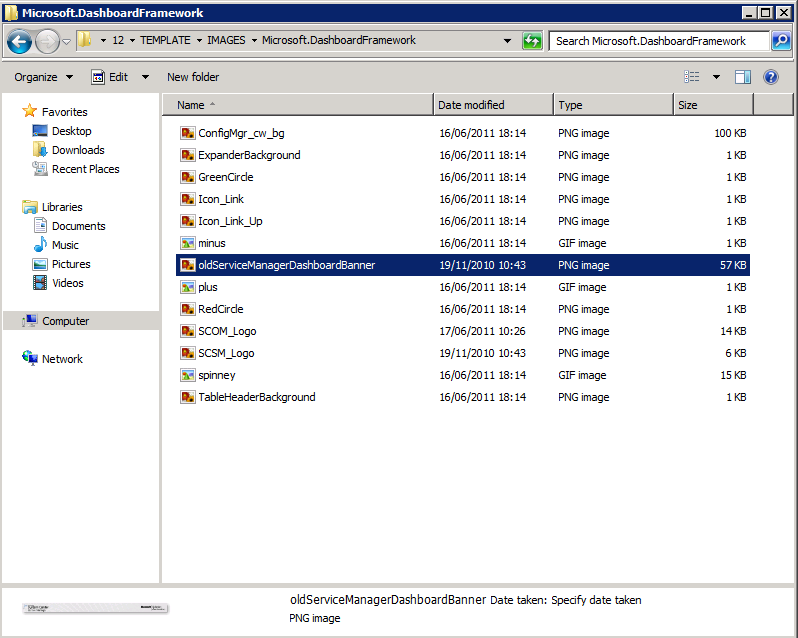
Next, we want to remove the 'System Center Service Manager' logo from the top left hand side of the screen and also remove the 'System Center Service manager Banner' from appearing in each window just below the tabs and replace it with either the SCOM banner or your company logo. To do this, we must first copy the new SCOM logo (it must be in .PNG format, you can use MS Paint to save your GIF and BMP files to PNG) that we want to replace it with (SCOM_Logo.png), to the following location:

C:\Program Files\Common Files\Microsoft Shared\Web Server Extensions\12\TEMPLATE\IMAGES\Microsoft.DashboardFramework


(Note - To make things easier, I have made available the SCOM_Logo.png and SCOM Banner.png files that I have used in this series to be downloaded from the link below)

http://sdrv.ms/10QgeLi


Secondly, to replace the banner, you need to rename the 'ServiceManagerDashboardBanner' to something like 'old.ServiceManagerDashboardBanner'.


Now you need to copy your new SCOM banner or company Logo (again the file needs to be in .PNG format) to the same location and rename that to the original banner name of 'ServiceManagerDashboardBanner.png'

(It's worth noting that at this point we are going to just retain the original Service Manager Banner name as there is too much messing around with XML files to repoint WSS 3.0 to a new filename.)


Now, all you have to do is to modify the name of the logo being used (SCSM_Logo.png to SCOM_Logo.png) from within the Dashboard Settings window as below


When you click 'OK' at the bottom, it is advisable that you delete your temporary internet files and also if needs be, restart the IIS admin and Sharepoint services to ensure the old logo and banner are not cached.

The end product should look something like this with your new logo and banner firmly in place!


Or if you used your own or a customers company logo instead of the SCOM banner, it would look something like this


Now that we have removed some of the Banner and Logo references to SCSM, in Part 4 of this series I will demonstrate how to customize the dashboard tabs to accurately reflect your SCOM environment.

SCOM Dashboards - Part 2 - Installing the Dashboard Solution Accelerator

Before reading this post, please ensure you have reviewed my previous posts on SCOM Dashboarding from the links below:

SCOM Dashboards - The Intro
SCOM Dashboards - Part 1 - Installing WSS 3.0

In this post, I will go through installing the Dashboard Solution Accelerator. If you are reading these posts, then you are probably aware of the fact that SCOM 2007 R2 doesn't come bundled with any easy-to-consume dashboards that you might want to use to present your infrastructure data to senior management or 'Level 100' service desk personnel. Instead, the dashboards that come out of the box with SCOM 2007 R2 are really only useful for either SCOM administrators or high level technical staff.

This is similar to the problem that System Center Configuration Manager (SCCM) and System Center Service Manager (SCSM) administrators were having and Microsoft resolved this by releasing a free solution accelerator dashboard solution for each of these two products - but not (on the surface of it) for SCOM!

The dashboards that these solution accelerators can produce are really impressive and work by injecting SQL queries into Web Parts and selecting the chart type such as Pie Chart, Graph, Scorecard etc. and then presenting the SQL data into a nice graphical interface to be displayed for all the (non-technical) world to see!

What Microsoft don't shout from the rooftops on these solution accelerators however is that  not only are they for SCCM and SCSM but they work perfectly with SCOM too! This post will explain how to install this solution and remove all references of SCSM or SCCM and replace it with SCOM!

For the purposes of this demonstration, I am going to be using the SCSM dashboard as it is newer than the SCCM dashboard and comes with the tabs pre-configured (you can manually create the additional tabs in your SCCM dashboard following the steps in these posts if you currently have that in use though).

To begin, download the SCSM dashboard solution accelerator from the following URL:

http://www.microsoft.com/download/en/details.aspx?displaylang=en&id=16445

Once you have downloaded the zip file, extract it to a location on your SCOM Management Server (or the server that you have installed WSS 3.0 onto) and using an account with Administrative permissions, double click on the installer as below


 Click next to continue


Input your administrative user account details and your SCOM SQL server and database names as below


On this screen, make sure you specify the server name that you installed the SQL database for the WSS 3.0 website onto in the 'Sharepoint Database Server Name' field and at this point, it is worth making a note of the URL and port number that the dashboard will be accessible from

Click 'Install' to continue


All going well, you should see the screen below when the wizard is finished installing the SCSM dashboard


Browse to the URL and port number that you noted earlier and you should see the default SCSM dashboard window similar to the one below


Now that we have the SCSM dashboard solution installed into our environment, Part 3 will be about customizing it and removing all the references to SCSM and replacing them with SCOM!

SCOM Dashboards - Part 1- Installing WSS 3.0

For any of the SCOM dashboards described in these posts to work, we need to install Microsoft's WSS 3.0. This is a scaled down version of Sharepoint 2007 and is also known as Microsoft Sharepoint Foundation. It is a free add-on to Microsoft Windows Server 2003 and 2008 providing a web portal with commonly needed features.

You can download WSS 3.0 (x64) from the link below:
(it is presumed that you are using Windows Server 2008 R2 for this blog series)

http://www.microsoft.com/download/en/details.aspx?id=5719


Double click on the 'Sharepoint.exe' file to start the installation screen below


Select the 'Advanced' button to progress


Select 'Web Front End' from the next screen as this option enables you to install the WSS databases onto an SQL server of your choice


Modify the 'Data Location' tab if needs be and then click 'Install Now'


Once the installer has completed, you should see the following screen. Make sure you leave the radio box ticked and click on 'Close' to run the Configuration Wizard


 Click 'Next' to begin the Sharepoint Configuration Wizard


Click 'Yes' to acknowledge the services will be rebooted


At this point, choose the 'No' option and click 'Next' (if you had an existing Sharepoint Server farm and are an experienced Sharepoint administrator, then you could select 'Yes' from here if you want)


Input your SQL server name and instance, leave the Database Name as it is and input in an active directory account that has preferably admin permissions on the SQL server


Decide whether to leave the port number as it is or to specify one here and also choose either NTLM or Kerberos authentication here too


This now completes your WSS 3.0 installation. Read on to configure user permissions within the WSS Farm.

Browse to the URL and port reference that was created during the WSS installation (generally something like http://servername:43695 from the example here)


Select the 'Site Settings' option from the 'Site Actions' button on the right hand side


Now select 'People and Groups'


Ensure 'Farm Administrators' is selected on the left hand side of the screen and then progress as shown below


From the final screen in this post, enter the user accounts and/or Active Directory groups that will be members of the 'Farm Administrators [Full Control]' group and click 'OK'


Close the 'Central Administration' screen now and continue onto Part 2 to install the Microsoft Dashboard Solution Accelerators that will form the basis of the SCOM dashboards.

SCOM Dashboards - The Intro

This is the first in a number of blog posts that I have decided to put together that will show how to build a complete custom dashboard solution for your System Center Operations Manager (SCOM) 2007 R2 environment that incorporates the System Center Service Manager (SCSM) Dashboard, the SCOM Service Level Dashboard (SLD) 2.0 and also a Distributed Applications Health State Scorecard into a seamless tabbed window for easy-on-the-eye SCOM data consumption.

Dashboarding in SCOM out of the box is very minimal and the only official SCOM dashboard that Microsoft have provided is the Service Level Dashboard 2.0 which looks great but is only really effective when pointed to Distributed Applications and their respective Service Level Objectives.

What SCOM was lacking was a dashboard solution that was supported by Microsoft, included the ability to present data such as 'Computers with the most Alerts', 'SCOM DB size', 'Distributed Application Health State', 'Noisiest alerts' etc; and most importantly one that was provided for FREE!

I have come across a great number of blog posts from the SCOM community that cover each of these aspects of SCOM Dashboarding individually but have found nothing out there that brings all of the solutions centrally together onto one site.

The posts that follow in this series will go into detail with the information that you need to create these solutions and customise them for your different client environments.

See below for the links to the other posts in this series:

SCOM Dashboards - Part 1- Installing WSS 3.0
SCOM Dashboards - Part 2 - Installing the Dashboard Solution Accelerator
SCOM Dashboards - Part 3 - Customizing the Dashboard Banner and Logo
SCOM Dashboards - Part 4 - Customizing the Dashboard Tabs
SCOM Dashboards - Part 5 - Installing the Service Level Dashboard (SLD 2.0)
SCOM Dashboards - Part 6 - Adding SQL Queries to the Dashboards
SCOM Dashboards - Part 7 - The SCOM Distributed Application Health State Tab
SCOM Dashboards - Part 8 - Adding the SLD Tab to the SCOM Dashboard
SCOM Dashboards - Conclusion and References