I had a requirement today to export a list of all the SCOM / OpsMgr 2012 agent managed devices to a CSV file and thought I'd do up a quick post in case anyone else finds it useful.
This also might come in handy as an add-in for your System Center 2012 Orchestrator runbooks too.
All that's needed is just a single line of PowerShell as follows:
SCOM 2012
get-scomagent|export-csv -notype c:\scomagentdevices.csv
SCOM 2007 R2
get-agent|export-csv -notype c:\scomagentdevices.csv
Just copy and paste the relevant line of script from above into PowerShell on one of your SCOM management servers to create a file on the C:\ drive called 'scomagentdevices.csv'. This CSV file contains all of the information available on the agent such as -Patchlist, PrimaryManagementServerName, ManagementGroup, ID, LastModified, Name, DisplayName, HostComputer - etc.
You can easily scope down the criteria to be exported by simply modifying the PowerShell line above to include a property value such as just the DisplayName as below:
SCOM 2012
get-scomagent|select DisplayName|export-csv -notype c:\scomagentdevices.csv
If you are presented with any errors within the Operations Manager Shell when you first open it such as:
The term '.\OperationsManager\Functions.ps1' is not recognized as the name of a
cmdlet, function, script file, or operable program. Check the spelling of the
name, or if a path was included, verify that the path is correct and try again.
At line:1 char:67
+ Import-Module OperationsManager; .\OperationsManager\Functions.ps1 <<<< ; .\O
perationsManager\Startup.ps1
+ CategoryInfo : ObjectNotFound: (.\OperationsManager\Functions.p
s1:String) [], CommandNotFoundException
+ FullyQualifiedErrorId : CommandNotFoundException
Then simply type the following in before running the export line of script outlined above:
import-module OperationsManager
Hopefully someone else finds this helpful too!

Kevin Greene's IT Blog. This is a blog about all things Cloud and Datacenter!
Monday, July 23, 2012

Monday, July 16, 2012
Quick Reference Post - SCOM (OpsMgr) 2012 Group Maintenance Mode Script
This post is as much a place-holder for me as it is for anyone else and something that is of utmost importance in System Center 2012 Operations Manager (SCOM / OpsMgr 2012) deployments.
Pete Zerger and Matthew Long of Infront Consulting have put together a nice and simple (but very effective) script that enables maintenance mode of groups in SCOM 2012.
This script has been designed to make scheduling it as a Windows Scheduled Task work seamlessly.
Check out the magic here:
OpsMgr 2012: Group Maintenance Mode via PowerShell (the way it should be)
Nice one guys :)
Pete Zerger and Matthew Long of Infront Consulting have put together a nice and simple (but very effective) script that enables maintenance mode of groups in SCOM 2012.
This script has been designed to make scheduling it as a Windows Scheduled Task work seamlessly.
Check out the magic here:
OpsMgr 2012: Group Maintenance Mode via PowerShell (the way it should be)
Nice one guys :)
SCOM 2012 - APM CSM vs. GSM and Web Application Monitoring....Confused?
Every time a new product is released, we get bombarded with loads of new acronyms to try get our heads around. Once we figure out what these acronyms mean, then we have to understand what new features they actually refer to and how (or if) we can use them in our deployments. System Center 2012 Operations Manager (SCOM /OpsMgr 2012) is no different.
APM
When Microsoft acquired AVIcode in 2010 and integrated it into SCOM 2012, we then had access to Application Performance Monitoring or APM straight out of the box. APM brings a new level of deep-dive monitoring and is designed to try and bridge the gap between the development and infrastructure teams responsible for your applications. A while back, I wrote a short series of blog posts on configuring APM and if you want to learn how to set it up in your environment, then check them out using the following link: SCOM 2012 - Configuring Application Performance Monitoring (APM)
CSM
With APM, we get two types of monitoring to work with from an application level. Server-side Monitoring and Client-Side Monitoring - also known as CSM. CSM works with a specified application from the 'inside' and raises alerts based on the actual code. It also has a pre-requisite that APM Server-Side Monitoring is configured first and that the IIS websites hosting the web application must also be discovered and monitored too.
The screenshot below shows an example of CSM in SCOM 2012

From a performance perspective, CSM can tell us when there is a performance related problem with our application and then deep-dive into it 'to tell us why' there’s a problem. CSM returns real data based on the users experience of the web application.
Web Application Monitoring
Web Application Monitoring is another feature that comes out of the box with SCOM 2012. It works with any given web application's URL to probe the application from the 'outside' using designated watcher nodes that have the SCOM agent installed on them.This type of monitoring also provides the functionality to record web browser sessions and the screenshot below shows an example of this in action.

To use Web Application Monitoring, there's no requirement to have APM or IIS monitoring in place first. Although this type of monitoring can certainly tell us that there's a performance issue when accessing a particular website, it 'cannot tell us why' there is a problem. Web Application Monitoring simulates the users experience of the web application.
Check out this post for more on Web Application Monitoring: SCOM 2012 - Recording a Web Browser Session
GSM
Recently, Microsoft announced the 2nd Customer Technology Preview (CTP2) release of Service Pack 1 for System Center 2012 which includes a new feature called Global Service Monitor or GSM. GSM is a cloud based service running on Microsoft's Azure platform that extends SCOM 2012 capabilities by providing a kind of "agents in the cloud" extension to your on-premise monitoring and delivering an 'outside-in' perspective of your applications.
It allows you to schedule automatic synthetic transactions from locations around the world providing the capability to monitor the availability, performance and reliability of your externally facing web applications as shown in the screenshot below. Essentially, GSM also simulates the users experience of the web application.
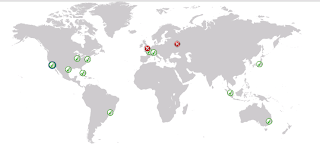
Microsoft's Åke Pettersson has put together a very informative blog post on configuring GSM that's well worth taking a look at here.
Better Together
From the information above, we can see that on the surface of it, you would be forgiven for thinking that they are all simply application monitoring features that deliver the same 'end goal'. It's understandable that some people might then presume that you don't need to deploy or use all of these features inside your SCOM 2012 environment and that one feature or the other would suffice.
When comparing these different application monitoring features however, it’s important to be aware that it most definitely isn’t a case of choosing one over the other. On the contrary, APM CSM, GSM and Web Application Monitoring all complement each other and, although they all monitor the users experience of the web application, they use very different methods to do it.

The best way to ensure that you get the full '360 Degree' monitoring view of your web applications is to first use APM CSM to deliver the rich in-depth code analysis that you need. Then to have it working in conjuction with GSM and Web Application Monitoring which have responsibility for probing the application websites for availability from locations all around the world and ensuring that web transactions are actually happening in the first place.
Don't forget of course, that if you want to be able to use APM CSM to manage alerts and exceptions that are generated from within your applications, you need to have users hitting your website and using the application in the first place. If nobody can access it by URL or if the performance of it is poor from certain locations around the world, then APM CSM alone won't be able to help you!
All things considered, it's always recommended to configure your application monitoring using a combination of all the above features to get the transparency that you need to be pro-active as opposed to re-active when it comes to resolving availability and performance issues.

An added bonus will also be a happy joining of your Dev and Ops teams when it comes to application troubleshooting!
APM
When Microsoft acquired AVIcode in 2010 and integrated it into SCOM 2012, we then had access to Application Performance Monitoring or APM straight out of the box. APM brings a new level of deep-dive monitoring and is designed to try and bridge the gap between the development and infrastructure teams responsible for your applications. A while back, I wrote a short series of blog posts on configuring APM and if you want to learn how to set it up in your environment, then check them out using the following link: SCOM 2012 - Configuring Application Performance Monitoring (APM)
CSM
With APM, we get two types of monitoring to work with from an application level. Server-side Monitoring and Client-Side Monitoring - also known as CSM. CSM works with a specified application from the 'inside' and raises alerts based on the actual code. It also has a pre-requisite that APM Server-Side Monitoring is configured first and that the IIS websites hosting the web application must also be discovered and monitored too.
The screenshot below shows an example of CSM in SCOM 2012

From a performance perspective, CSM can tell us when there is a performance related problem with our application and then deep-dive into it 'to tell us why' there’s a problem. CSM returns real data based on the users experience of the web application.
Web Application Monitoring
Web Application Monitoring is another feature that comes out of the box with SCOM 2012. It works with any given web application's URL to probe the application from the 'outside' using designated watcher nodes that have the SCOM agent installed on them.This type of monitoring also provides the functionality to record web browser sessions and the screenshot below shows an example of this in action.

To use Web Application Monitoring, there's no requirement to have APM or IIS monitoring in place first. Although this type of monitoring can certainly tell us that there's a performance issue when accessing a particular website, it 'cannot tell us why' there is a problem. Web Application Monitoring simulates the users experience of the web application.
Check out this post for more on Web Application Monitoring: SCOM 2012 - Recording a Web Browser Session
GSM
Recently, Microsoft announced the 2nd Customer Technology Preview (CTP2) release of Service Pack 1 for System Center 2012 which includes a new feature called Global Service Monitor or GSM. GSM is a cloud based service running on Microsoft's Azure platform that extends SCOM 2012 capabilities by providing a kind of "agents in the cloud" extension to your on-premise monitoring and delivering an 'outside-in' perspective of your applications.
It allows you to schedule automatic synthetic transactions from locations around the world providing the capability to monitor the availability, performance and reliability of your externally facing web applications as shown in the screenshot below. Essentially, GSM also simulates the users experience of the web application.

Microsoft's Åke Pettersson has put together a very informative blog post on configuring GSM that's well worth taking a look at here.
Better Together
From the information above, we can see that on the surface of it, you would be forgiven for thinking that they are all simply application monitoring features that deliver the same 'end goal'. It's understandable that some people might then presume that you don't need to deploy or use all of these features inside your SCOM 2012 environment and that one feature or the other would suffice.
When comparing these different application monitoring features however, it’s important to be aware that it most definitely isn’t a case of choosing one over the other. On the contrary, APM CSM, GSM and Web Application Monitoring all complement each other and, although they all monitor the users experience of the web application, they use very different methods to do it.
The best way to ensure that you get the full '360 Degree' monitoring view of your web applications is to first use APM CSM to deliver the rich in-depth code analysis that you need. Then to have it working in conjuction with GSM and Web Application Monitoring which have responsibility for probing the application websites for availability from locations all around the world and ensuring that web transactions are actually happening in the first place.
Don't forget of course, that if you want to be able to use APM CSM to manage alerts and exceptions that are generated from within your applications, you need to have users hitting your website and using the application in the first place. If nobody can access it by URL or if the performance of it is poor from certain locations around the world, then APM CSM alone won't be able to help you!
All things considered, it's always recommended to configure your application monitoring using a combination of all the above features to get the transparency that you need to be pro-active as opposed to re-active when it comes to resolving availability and performance issues.
An added bonus will also be a happy joining of your Dev and Ops teams when it comes to application troubleshooting!
Friday, July 13, 2012
SCOM 2012 Network Monitoring - Dude, Where's My Network Device Components?
With System Center 2012 Operations Manager (SCOM / OpsMgr 2012), we now have some excellent new Network Monitoring functionality that I've previously blogged about how to configure and described what type of discoveries where available.
Sometimes though, when administrators or consultants deploy the SCOM 2012 Network Monitoring feature, they find that SCOM doesn't retrieve the information and discoveries on their network devices that they had initally hoped for or read about.
Instead they find that all that get's discovered is the network interface that the device was initally discovered on and it has simply performed an availability poll to return a health status back to the console- effectively giving them just a simple "Up or Down" scenario which is pretty much the same type of network monitoring that was made available out of the box with SCOM 2007 R2.
The screenshot below shows an example of this basic level of network monitoring

If this scenario seems familiar to you and you are contemplating scrapping the built-in network monitoring features of SCOM 2012 and instead downloading and importing the old and reliable xSNMP Extensions MP that delivered so much in SCOM 2007 R2, then DON'T!
First up, the xSNMP Extensions MP breaks cookdown in SCOM 2012 and won't work. All it will do is impact performance in your newly deployed SCOM 2012 environment and cause you endless headache.
Secondly, there is a valid reason as to why you are only seeing basic availability monitoring with your network devices.
SCOM 2012 lets you discover and monitor a large variety of different vendors network devices. It monitors any network device that supports SNMP and also provides extended monitoring for devices that implement the Management Information Base (MIB) RFC 2863 and MIB-II RFC 1213 standards.
It's this extended monitoring that delivers the deep level discoveries and performance data that you are looking for.
Microsoft have published an Excel spreadsheet with a list of over 800 network devices that support the extended monitoring capability of SCOM 2012. The information in the list is based on OID, device type, vendor, model name, and whether or not the processor and memory are monitored as part of the extended monitoring function.
The Excel spreadsheet list can be downloaded from here:
http://www.microsoft.com/en-us/download/details.aspx?displaylang=en&id=26831
From the spreadsheet (see screenshot below) you can see what level of network monitoring you can expect from your device.

The level of information that you are going to see is dependent on the MIB that Microsoft has used in the discovery. If your device is on the list then it will be “Certified” and this means that some level of detailed monitoring will take place that can include information on Processor, Memory and Chassis.
The screen below shows an example of a Certified network device in SCOM

If your network device is not on the Excel spreadsheet then it will be discovered in SCOM as a “Generic” network device, and it's this type of basic monitoring that you would have encountered in the first place.
A quick way to see what type of monitoring is available for your already discovered network devices in SCOM is to simply click on the Monitoring tab within the Operations Manager console, then browse to the Network Monitoring folder and click on the Network Devices view.
Once here, click on the Personalize View link from the Tasks pane on the right-hand side of the screen and in the Columns To Display section, choose the Certification check box then click OK

This view will then show you the type of certification that your network device holds as shown below

Hopefully this post has now given you an understanding of the different certification types and the associated diagram views they can produce for your network devices.
Sometimes though, when administrators or consultants deploy the SCOM 2012 Network Monitoring feature, they find that SCOM doesn't retrieve the information and discoveries on their network devices that they had initally hoped for or read about.
Instead they find that all that get's discovered is the network interface that the device was initally discovered on and it has simply performed an availability poll to return a health status back to the console- effectively giving them just a simple "Up or Down" scenario which is pretty much the same type of network monitoring that was made available out of the box with SCOM 2007 R2.
The screenshot below shows an example of this basic level of network monitoring

If this scenario seems familiar to you and you are contemplating scrapping the built-in network monitoring features of SCOM 2012 and instead downloading and importing the old and reliable xSNMP Extensions MP that delivered so much in SCOM 2007 R2, then DON'T!
First up, the xSNMP Extensions MP breaks cookdown in SCOM 2012 and won't work. All it will do is impact performance in your newly deployed SCOM 2012 environment and cause you endless headache.
Secondly, there is a valid reason as to why you are only seeing basic availability monitoring with your network devices.
SCOM 2012 lets you discover and monitor a large variety of different vendors network devices. It monitors any network device that supports SNMP and also provides extended monitoring for devices that implement the Management Information Base (MIB) RFC 2863 and MIB-II RFC 1213 standards.
It's this extended monitoring that delivers the deep level discoveries and performance data that you are looking for.
Microsoft have published an Excel spreadsheet with a list of over 800 network devices that support the extended monitoring capability of SCOM 2012. The information in the list is based on OID, device type, vendor, model name, and whether or not the processor and memory are monitored as part of the extended monitoring function.
The Excel spreadsheet list can be downloaded from here:
http://www.microsoft.com/en-us/download/details.aspx?displaylang=en&id=26831
From the spreadsheet (see screenshot below) you can see what level of network monitoring you can expect from your device.

The level of information that you are going to see is dependent on the MIB that Microsoft has used in the discovery. If your device is on the list then it will be “Certified” and this means that some level of detailed monitoring will take place that can include information on Processor, Memory and Chassis.
The screen below shows an example of a Certified network device in SCOM

If your network device is not on the Excel spreadsheet then it will be discovered in SCOM as a “Generic” network device, and it's this type of basic monitoring that you would have encountered in the first place.
A quick way to see what type of monitoring is available for your already discovered network devices in SCOM is to simply click on the Monitoring tab within the Operations Manager console, then browse to the Network Monitoring folder and click on the Network Devices view.
Once here, click on the Personalize View link from the Tasks pane on the right-hand side of the screen and in the Columns To Display section, choose the Certification check box then click OK

This view will then show you the type of certification that your network device holds as shown below

Hopefully this post has now given you an understanding of the different certification types and the associated diagram views they can produce for your network devices.
Thursday, July 12, 2012
SCOM 2012 Network Monitoring - Explicit or Recursive Discoveries?
In System Center 2012 Operations Manager (SCOM / OpsMgr 2012), the Network Monitoring feature has been taken to another level when we compare it to it's predecessor SCOM 2007 R2. A while back, I wrote a blog post explaining the steps required to get up and running with SCOM 2012 Network Monitoring and it's a good starting point if you're looking to explore this new feature. Check out the original post here:
SCOM 2012 - Network Monitoring Magic!
In the steps outlined in that post, when setting up your network monitoring, you have the option to choose from two types of network discovery rules - Explicit and Recursive. The screenshot below shows the option for selecting either of these two rules

Since April, I've been responsible for a LOT of SCOM 2012 deployments for our customers and often get asked to explain the difference between these two network discovery options. This post will aim to give you a better insight into each of them and will offer some advice on when to use each one.
In SCOM 2012, when configuring your network monitoring, you need to create a discovery rule on a Management Server that will run the network discovery either on an automatic schedule or manual on-demand basis. A discovery rule has some restrictions so to speak though:
Explicit Discovery
This type of discovery rule is similar to what we had to work with in SCOM 2007 and it only attempts to discover devices that you have explicitly specified in the wizard by their IP address or FQDN.
Unlike SCOM 2007 though, if you have a large number of network devices that you want to explicitly add all at once, then instead of having to do them one by one or by network subnet (familiar anyone?), you now have the option to specify a text (*.txt) file with a list of all the device names or IP addresses that can be imported into SCOM. This is a massive time saver and a welcome addition to the discovery process.
Recursive Discovery
This discovery is completely new to SCOM and is a 'party piece' of the EMC Smarts (Ionix) technology that forms the basis for network monitoring in the 2012 release.
When you select this discovery option and work through the wizard, you will come to the exact same 'Specify Devices' dialog box (shown in the screenshot below) that you would have encountered when configuring an Explicit discovery and this can initially be a little confusing.

Recursive discovery functions by performing a network scan and attempting to initially discover devices that you have explicitly specified in the above dialog box. Similar to the Explicit discovery rule, Recursive discovery can also be configured to discover and access devices using ICMP, SNMP or both. You could also use an IPv6 addresses however; the initial device that is discovered must use an IPv4 address.That's where the comparison with Explicit discovery ends though.
Recursive discovery will then try to discover any other network devices it knows about through its Address Routing Protocol (ARP) table, its IP address table, or the topology Management Information Block (MIB) to grow the network map and present all applicable devices to you for monitoring.
You can also filter out devices that you don't want to be discovered by using properties such as the device type, name, and object identifier (OID). This is a handy option if you wanted to quickly discover all the network devices in your network except, a small number or some with a specific criteria.
In really large networks with a lot of network devices, keep in mind that there is a default limit of 1500 network devices that can be discovered recursively. You can of course tweak this limit to suit your environment if you wish, but for most people, this won't be needed.
Great, but which is the best discovery rule to use?
This is a tough question as every network environment is different and there's no right or wrong answer here.
Explicit Discovery Pro's
I find that using the Explicit discovery option is the easiest way to control what gets monitored while carrying out new SCOM deployments. It's most likely that you will already know all of the network devices that you will want to have discovered if it's your own network, or if you're out on a customer site deploying SCOM, then the customer will have handed you a list of network devices to start monitoring. This method is useful also for controlling alerts and ensuring that your tuning and noise reduction process is confined to a certain number of network devices initally.
Explicit Discovery Con's
You need to have a list of all of the network devices that you want to monitor with SCOM 2012 and this can be cumbersome trying to put together or a lot of the time, if you arrive onsite with a customer to configure this, they might not have an up-to-date list of their devices and there's always a chance that you've missed something important.
Recursive Discovery Pro's
The Recursive discovery is definitely the 'sexier' of the two rules and you'll get a buzz from seeing all of the network devices getting discovered automatically in a relatively short space of time with very little input from you required. If you don't have a list of all the network devices on your network, then use this option to probe the ARP cache and discover everything for you.
SCOM 2012 - Network Monitoring Magic!
In the steps outlined in that post, when setting up your network monitoring, you have the option to choose from two types of network discovery rules - Explicit and Recursive. The screenshot below shows the option for selecting either of these two rules

Since April, I've been responsible for a LOT of SCOM 2012 deployments for our customers and often get asked to explain the difference between these two network discovery options. This post will aim to give you a better insight into each of them and will offer some advice on when to use each one.
In SCOM 2012, when configuring your network monitoring, you need to create a discovery rule on a Management Server that will run the network discovery either on an automatic schedule or manual on-demand basis. A discovery rule has some restrictions so to speak though:
- Only one discovery rule can be configured per Management Server.
- A discovery rule can only perform one or the other of an explicit or recursive discovery and cannot perform a combination of them.
Explicit Discovery
This type of discovery rule is similar to what we had to work with in SCOM 2007 and it only attempts to discover devices that you have explicitly specified in the wizard by their IP address or FQDN.
Unlike SCOM 2007 though, if you have a large number of network devices that you want to explicitly add all at once, then instead of having to do them one by one or by network subnet (familiar anyone?), you now have the option to specify a text (*.txt) file with a list of all the device names or IP addresses that can be imported into SCOM. This is a massive time saver and a welcome addition to the discovery process.
Recursive Discovery
This discovery is completely new to SCOM and is a 'party piece' of the EMC Smarts (Ionix) technology that forms the basis for network monitoring in the 2012 release.
When you select this discovery option and work through the wizard, you will come to the exact same 'Specify Devices' dialog box (shown in the screenshot below) that you would have encountered when configuring an Explicit discovery and this can initially be a little confusing.

Recursive discovery functions by performing a network scan and attempting to initially discover devices that you have explicitly specified in the above dialog box. Similar to the Explicit discovery rule, Recursive discovery can also be configured to discover and access devices using ICMP, SNMP or both. You could also use an IPv6 addresses however; the initial device that is discovered must use an IPv4 address.That's where the comparison with Explicit discovery ends though.
Recursive discovery will then try to discover any other network devices it knows about through its Address Routing Protocol (ARP) table, its IP address table, or the topology Management Information Block (MIB) to grow the network map and present all applicable devices to you for monitoring.
You can also filter out devices that you don't want to be discovered by using properties such as the device type, name, and object identifier (OID). This is a handy option if you wanted to quickly discover all the network devices in your network except, a small number or some with a specific criteria.
In really large networks with a lot of network devices, keep in mind that there is a default limit of 1500 network devices that can be discovered recursively. You can of course tweak this limit to suit your environment if you wish, but for most people, this won't be needed.
Great, but which is the best discovery rule to use?
This is a tough question as every network environment is different and there's no right or wrong answer here.
Explicit Discovery Pro's
I find that using the Explicit discovery option is the easiest way to control what gets monitored while carrying out new SCOM deployments. It's most likely that you will already know all of the network devices that you will want to have discovered if it's your own network, or if you're out on a customer site deploying SCOM, then the customer will have handed you a list of network devices to start monitoring. This method is useful also for controlling alerts and ensuring that your tuning and noise reduction process is confined to a certain number of network devices initally.
Explicit Discovery Con's
You need to have a list of all of the network devices that you want to monitor with SCOM 2012 and this can be cumbersome trying to put together or a lot of the time, if you arrive onsite with a customer to configure this, they might not have an up-to-date list of their devices and there's always a chance that you've missed something important.
Recursive Discovery Pro's
The Recursive discovery is definitely the 'sexier' of the two rules and you'll get a buzz from seeing all of the network devices getting discovered automatically in a relatively short space of time with very little input from you required. If you don't have a list of all the network devices on your network, then use this option to probe the ARP cache and discover everything for you.
You can also create a schedule to run your recursive discovery rule a number of times a day/week/month etc. and for this reason it's very useful if you have a high turnover of network devices spread across your environment.
Recursive Discovery Con's
The downside to Recursive discovery scheduling though is that, it can put unnecessary load on your management servers in large network environments by discovering devices that ordinarily you have no requirement to monitor and manage. It's also not recommended to run this more than twice a week in large environments that don't have a high turnover of network devices.
Conclusion
So that's it! Hopefully this post has gone some way to helping you understand what the difference is between the Explicit and Recursive discovery rules in SCOM 2012. If you want to learn more about SCOM 2012 Network Monitoring and the difference between Certified and Generic devices, take a look at this post:
SCOM 2012 Network Monitoring - Dude, Where's My Network Device Components?
Recursive Discovery Con's
The downside to Recursive discovery scheduling though is that, it can put unnecessary load on your management servers in large network environments by discovering devices that ordinarily you have no requirement to monitor and manage. It's also not recommended to run this more than twice a week in large environments that don't have a high turnover of network devices.
Conclusion
So that's it! Hopefully this post has gone some way to helping you understand what the difference is between the Explicit and Recursive discovery rules in SCOM 2012. If you want to learn more about SCOM 2012 Network Monitoring and the difference between Certified and Generic devices, take a look at this post:
SCOM 2012 Network Monitoring - Dude, Where's My Network Device Components?
Friday, June 22, 2012
IPD Guide for System Center 2012 - Virtual Machine Manager (BETA)
The new Infrastructure Planning and Design Guide (IPD) for System Center 2012 Virtual Machine Manager (VMM) is now available for BETA review from the Microsoft Connect Site.
The IPD guides are invaluable when designing a technology solution for your clients or own internal business and are the first port of call for me anytime I'm carrying out a new type of deployment for our customers.
This one is 40 pages long and deep dives into the VMM 2012 architecture, sample scenarios and design best practices.
You can register and download the VMM 2012 IPD from here:
https://connect.microsoft.com/InvitationUse.aspx?ProgramID=1587&InvitationID=IPDM-QX6H-7TTV&SiteID=14
The IPD guides are invaluable when designing a technology solution for your clients or own internal business and are the first port of call for me anytime I'm carrying out a new type of deployment for our customers.
This one is 40 pages long and deep dives into the VMM 2012 architecture, sample scenarios and design best practices.
You can register and download the VMM 2012 IPD from here:
https://connect.microsoft.com/InvitationUse.aspx?ProgramID=1587&InvitationID=IPDM-QX6H-7TTV&SiteID=14
Friday, June 15, 2012
MCSE Private Cloud Exam - Monitoring & Operating a Private Cloud with System Center 2012 - Passed!
After seeing some of the other attendees of MMS 2012 updating their blog's with news that they had passed the BETA MCSE Private Cloud exams that they had tested on over in Vegas, I dreaded the worst this morning when I went to check my own results.
Before I left for Vegas back in April, I had booked myself in to sit exam number 071-246 - 'Monitoring & Operating a Private Cloud w/System Center 2012' on the Thursday. I had picked the Thursday intentionally because after attending MMS 2011 last year, I knew that the Monday, Tuesday and Wednesday morning's would be filled with hangovers from the parties being held the nights before - I know, it's a tough life! With the MMS 2012 closing party being held on the Thursday night, I figured for sure that the Friday morning would be a no-go so Thursday afternoon seemed the best choice to sit the exam.
After attending an excellent Exam Cram session by UK System Center MVP Gordon McKenna during the day on the Wednesday and taking it nice and easy that night with a meal and a couple of quiet drinks out with the Irish contingent (honest!), I felt I'd be ready to take the exam no problem the next day........How wrong I was!
I didn't take into account that during the day over there at around 16:00, due to the jet lag and total lack of sleep during the early part of the week, just as I was sitting the exam, my body decided it wanted to go to sleep! I spent the next two hours trying to literally keep my eyes open while doing the exam and I'm sure at one stage, the exam attendent caught me closing my eyes too!
The fact that out of a total of 60 questions on the exam, I counted 21 of them that were asked on Service Manager - which is not part of my Kung Fu just yet, I was full sure I'd failed the exam at that point and couldn't argue with the impending result.
Fast forward to this morning again and I've just found out that despite everything, I managed to pass the exam!

It turns out that I must know a little bit about System Center 2012 after all!
Before I left for Vegas back in April, I had booked myself in to sit exam number 071-246 - 'Monitoring & Operating a Private Cloud w/System Center 2012' on the Thursday. I had picked the Thursday intentionally because after attending MMS 2011 last year, I knew that the Monday, Tuesday and Wednesday morning's would be filled with hangovers from the parties being held the nights before - I know, it's a tough life! With the MMS 2012 closing party being held on the Thursday night, I figured for sure that the Friday morning would be a no-go so Thursday afternoon seemed the best choice to sit the exam.
After attending an excellent Exam Cram session by UK System Center MVP Gordon McKenna during the day on the Wednesday and taking it nice and easy that night with a meal and a couple of quiet drinks out with the Irish contingent (honest!), I felt I'd be ready to take the exam no problem the next day........How wrong I was!
I didn't take into account that during the day over there at around 16:00, due to the jet lag and total lack of sleep during the early part of the week, just as I was sitting the exam, my body decided it wanted to go to sleep! I spent the next two hours trying to literally keep my eyes open while doing the exam and I'm sure at one stage, the exam attendent caught me closing my eyes too!
The fact that out of a total of 60 questions on the exam, I counted 21 of them that were asked on Service Manager - which is not part of my Kung Fu just yet, I was full sure I'd failed the exam at that point and couldn't argue with the impending result.
Fast forward to this morning again and I've just found out that despite everything, I managed to pass the exam!

It turns out that I must know a little bit about System Center 2012 after all!
Thursday, June 14, 2012
TechEd 2012 North America - Download the Sessions Offline
Stefan Roth has been at it again with his offline viewing scripts but this time, instead of giving us a quick and easy way to download MMS 2012 sessions, he has modified his script to enable the download of the TechEd 2012 Orlando sessions in much the same way.
Check out his blog posting here with instructions on how to download the script and what you need to do for it to work:
http://blog.scomfaq.ch/2012/06/13/teched-2012-orlando-download-sessions-offline-viewing/
Thanks again Stefan!
Check out his blog posting here with instructions on how to download the script and what you need to do for it to work:
http://blog.scomfaq.ch/2012/06/13/teched-2012-orlando-download-sessions-offline-viewing/
Thanks again Stefan!
Wednesday, June 13, 2012
SCOM 2012 - More Free Stuff - Veeam Extended Generic Report Library MP
Following quickly on from my last post about the free dashboard authoring tool and samples that the OpsMgr product team have released, now it's Veeam's turn to offer up a free management pack for SCOM 2012.
Thanks to Chris Dearden of Veeam UK for bringing this one to my attention
Although the reporting functionality inside SCOM 2012 is really excellent, the Veeam Extended Generic Report Library (GRL) includes the following reports:

The cool thing about this reporting extension is that it DOES NOT require any Veeam products or other Veeam management packs to run. The reports can be targeted at any of the objects in your SCOM environment that the standard Generic Report Library that comes out of the box with SCOM can run against.
The GRL is compatible with both SCOM 2012 and SCOM 2007 R2 but a pre-requsisite is to ensure you are running SSRS 2008 upwards for your reporting engine.
Check out the link below to register and download the free management pack and accompanying guide:
http://www.veeam.com/extended-generic-report-library.html
Thanks to Chris Dearden of Veeam UK for bringing this one to my attention
Although the reporting functionality inside SCOM 2012 is really excellent, the Veeam Extended Generic Report Library (GRL) includes the following reports:
- Veeam Alert Statistics Report - Analyze alert statistics in two modes – per rule/monitor and per object
- Veeam Generic Performance Top (Bottom) N Report - Show infrastructure objects, performance counters, or both, for a specific rule
- Veeam Performance Report - Visualize performance counter values on one or more charts and tables
- Veeam Performance Details Report - Analyze trends with drill down to performance details

The cool thing about this reporting extension is that it DOES NOT require any Veeam products or other Veeam management packs to run. The reports can be targeted at any of the objects in your SCOM environment that the standard Generic Report Library that comes out of the box with SCOM can run against.
The GRL is compatible with both SCOM 2012 and SCOM 2007 R2 but a pre-requsisite is to ensure you are running SSRS 2008 upwards for your reporting engine.
Check out the link below to register and download the free management pack and accompanying guide:
http://www.veeam.com/extended-generic-report-library.html
SCOM 2012 - Free Dashboard Authoring Tool from the OpsMgr Product Team
The OpsMgr (SCOM) product team have yesterday just released a really cool tool and some management packs that allow you to customise and author SCOM 2012 dashboard widgets and then save them into an unsealed Management Pack for export to a different Management Group.
This is a huge benefit in that normally, if you have created your customized dashboard widgets and have them deployed in your Management Group (such as Pre-Production), then you want to move these dashboards to another Management Group (Production for example), it won't work because the original dashboard widget has dependencies on the GUID reference for your first management group.
You can also create a console task that launches your pre-configured dashboard from the Navigation view every time you select a computer - another handy feature.
There are two dashboard templates that this solution offers:
Summary Dashboard
Task Pane Dashboard
Have a look at the link below to get a full overview of what's on offer and how to download and configure it:
http://blogs.technet.com/b/momteam/archive/2012/06/12/free-windows-server-2008-dashboards-for-opsmgr-2012-and-tool-to-help-create-your-own-customized-dashboards.aspx
This is a huge benefit in that normally, if you have created your customized dashboard widgets and have them deployed in your Management Group (such as Pre-Production), then you want to move these dashboards to another Management Group (Production for example), it won't work because the original dashboard widget has dependencies on the GUID reference for your first management group.
You can also create a console task that launches your pre-configured dashboard from the Navigation view every time you select a computer - another handy feature.
There are two dashboard templates that this solution offers:
Summary Dashboard
- Ability to create a custom template layout
- Use any widgets available in the product
- Can be hosted under any MP folder view
Task Pane Dashboard
- Ability to create a custom template layout
- Use any widgets available in the product
- Shows up in the task pane when you select a particular target
Have a look at the link below to get a full overview of what's on offer and how to download and configure it:
http://blogs.technet.com/b/momteam/archive/2012/06/12/free-windows-server-2008-dashboards-for-opsmgr-2012-and-tool-to-help-create-your-own-customized-dashboards.aspx
Subscribe to:
Posts (Atom)