Monday, April 24, 2017

Monitoring Commvault with SCOM

A common request I get from customers is how to best monitor Commvault backups using SCOM. Commvault are one of the market leaders in enterprise backup technologies and I come across their products in customer sites on a regular basis.


As I don’t have a spare Commvault server to play around with in my demo environment and I’ve never really had the time to document the whole process during an actual customer deployment, a blog post on this topic has remained elusive until now.

A few weeks back I was working on a customer site who needed Commvault monitored and over the course of a lunch break one day, I managed to put some screenshots together to help document the process.

Overall, it’s pretty straight-forward to get up and running and unlike some other enterprise backup vendors, Commvault have made an effort to integrate their product with SCOM. The integration is made possible by initiating the integration from the Commvault CommCell Browser console – which then imports an unsealed management pack into SCOM for monitoring.

The management pack provided by Commvault is basic enough though and you’ll probably want to add some custom monitors and views to it as you see fit.

Management Pack Overview

The unsealed management pack provided contains a discovery rule which targets the Windows Computer class. This discovery rule (shown in the exported Excel sheet below) looks for the presence of the 'Commvault Server Event Manager Service' (the actual service name is GxEvMgrS).


When this service is detected, a new class named 'Commvault CommServer' is then created by the management pack. The class information in the management pack is shown in the image below.


There are three rules in the management pack that can generate Critical, Warning or Informational alerts in SCOM.


These rules target a CSV file named 'GalaxySCOM.csv' as their data source. This CSV file is created automatically by the Commvault application and is stored in the '\Program Files\Commvault\ContentStore\SCOM' directory on the Commvault server.

Getting Started

The first thing I'd recommend you do before deploying the Commvault management pack is to make a full list of all the Windows Services relating to Commvault that you wish to monitor. The reason for this is that the Commvault management pack will only monitor whether or not the 'Commvault Server Event Manager Service' (GxEvMgrS) service is up and running. This may be the only Commvault service you're interested in or most likely, you'll have a few more of them that are important to you.

Use the following line of PowerShell to export a list of all Windows Services on your Commvault server to a CSV file:

Get-Service | Sort-Object -Property DisplayName | Export-CSV -path C:\winserviceexport.csv

Once you've identified the service names you need for Commvault, check out my recent blog post here for a quick and easy way to monitor custom lists of Windows Services in SCOM.

The image below shows an example of the Commvault-specific services a customer recently requested to be monitored on all their Commvault servers:


Deploying the Management Pack

When you have all the Commvault services monitored, launch the CommCell Browser using an account with the required administrative permissions and you should be presented with a view similar to the one in the image below. From there, click the Control Panel button from the navigation bar at the top.


When the Control Panel area opens, you need to click the SCOM option from the Monitoring section as shown here....


This opens up the SCOM dialog box (shown below) and here, you need to input your SCOM server name along with a user account and password that has been assigned SCOM Administrator permissions.


When you've added your credentials, hit the Apply button to confirm and then click Test Configuration to validate communication between Commvault and your SCOM server is working as expected.

When you receive confirmation that the test was successful, hit the Import Management Pack button to begin the import of the unsealed management pack into SCOM.

When the process is complete, you should see a status message similar to the one in the image below that confirms the Commvault management pack has been configured...


A quick check of the Installed Management Packs view in the SCOM console confirms the management pack has been imported and is ready to go...


You should now see the four simple alert views under the CommVault Operations Manager folder in the Monitoring workspace as shown here....


If you want to confirm the new class has been created and discovered, scope your Discovered Inventory view to CommVault CommServer and you should then see all monitored Commvault servers that SCOM knows about.


Opening a Health Explorer view from the newly discovered CommVault CommServer class object shows how basic this management pack actually is with just the one Service Running State monitor in place to let you know the health state of the Commvault Windows Service.


A quick jump over to the Authoring workspace and we can see the three new Commvault alert rules that have been imported (these rules all target the new Commvault CommServer class).


A check of the Data Source properties for each of the rules gives us the location and CSV file name that will be used to collect alert information from the Commvault server...


Each rule's Data Source has been configured with a wildcard Expression value relevant to the type of alert that will fire (e.g. *Critical*, *Warning* or *Informational*).


If you want to change the name or alert description format of the alert response, you can do that from the Alert properties as shown here...


Configuring the Integration

Once the management pack has been imported and your Commvault servers have been discovered, launch the CommCell Browser again, click Alert from the navigation bar and click the Configure Alert option as shown in the following image...


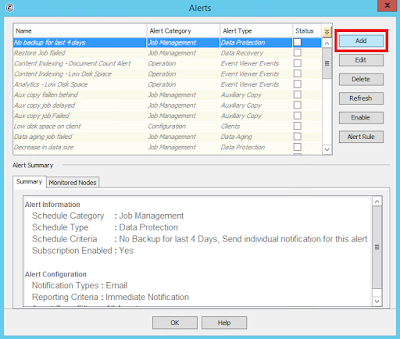
When the Alerts window opens, you'll be presented with a list of all enabled and disabled alerts in Commvault. We'll click the Add button here to begin the process of creating an alert for SCOM.


From the Add Alert Wizard, type a name for the SCOM alert then choose a category and type. In our example we'll create an alert called Failed Backups and we'll choose the Job Management category with a type of Data Protection.


When you're ready, click Next to move on.

At the Entities Selection window, choose the client groups and/or clients that this alert will be scoped to then hit Next to continue.


From the Threshold and Notification Criteria Selection window, use the Alert Criteria section to scope the alert to the criteria that you need. In our example, we're only interested in Job Failed, Job Skipped and Job Succeeded with Errors alerts. Ignore the other options outside the Alert Criteria section and click Next to move on when you've made your criteria selections.


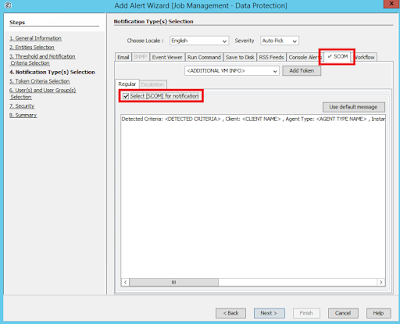
At the Notification Type(s) Selection window, click the SCOM tab then enable the Select [SCOM] for notification check box as shown in the following image...


Hit Next to continue.

At the Token Criteria Selection window you can optionally add rules to the alert that will dictate if the alerts are sent or not. You can get a full list and description of the alert tokens from here.


We won't specify any rules in our example and when you're ready, click Next to move on.

From the Security window, use the Add button to specify the user accounts and groups that you wish to grant permissions for the alert to (we'll configure an admin account with the Alert Owner role for this alert).


Click Next to move on and at the Summary window (shown in the image below), confirm your settings and hit Finish to end the wizard.


Back in the Alerts view of the CommCell Browser, you can check that the new alert has been created and is enabled as shown below...


That's all you should need to do to configure the integration between Commvault and SCOM and the next time an alert condition has been met, you should see the alert dropping into the Monitoring workspace of the SCOM console similar to this one...


If you've create a new distributed application model in SCOM for Commvault and you use either the Windows Computer or CommVault CommServer class in your component groups, these alerts will rollup to change the health of the model as expected.

Conclusion

Using the walk-through in this post should help people get up and running when monitoring Commvault with SCOM and with some additional distributed application service modeling, SLA planning and dashboard design, you can get some really nice visibility of your backup environments all from a single console.

Monday, April 10, 2017

SCOM - New Community MP for Monitoring Windows Services

A couple of months ago I came across a blog post from SCOM community contributor Andy Leibundgut describing a new management pack he'd authored to help monitor Windows Services using SCOM and I was keen to give it a test drive to see exactly what it could do.


Built-in Windows Service Monitoring Option

You might be thinking to yourself that this capability has to be available already out of the box with SCOM and you'd be correct. The Windows Service Monitoring Template (accessible from the Authoring workspace in the SCOM console and shown in the image below) will walk you through a wizard to help configure a custom monitor for a Windows Service that might not be automatically monitored with a vendor management pack.


The Problem

This template wizard certainly meets the requirements of bringing Windows services into SCOM but as Andy points out in his post, there's a lot of monitoring bloat that comes with each service monitoring configuration you create using the template - each service has its own class, its own discovery and comes with 3 monitors and 8 overrides!

Also, if you have a large number of custom Windows services to monitor (a common request from my customers), then using the built-in template in the console to create a monitor for each one can be fairly time-consuming.

The Solution

With these points in mind, Andy looked into a better method of spinning up monitors in SCOM for Windows services without having to deal with the extra bloat and cumbersome on-boarding process for multiple services. The solution he came up with comprises a new management pack and a PowerShell-based Service MP Editor complete with an easy-to-follow user interface (shown below).


Along with the Service MP Editor, the new management pack contains the following features for monitoring Windows Services:

  • Uses the same data source for Windows Service monitoring that SCOM uses.
  • Date and time filtering so you can exclude certain days/times from monitoring on a per-service or service object basis.
  • Handy console tasks for starting, stopping and checking the status of the Windows Service.
  • Automatic service recovery (disabled by default). Works on a 3 strikes and you’re out format (overrideable setting where after 3 failures in a 24 hour period it will stop trying to restart the service). 
  • Timer reset monitor (closes itself after 24 hours and enabled by default) to watch for and alert on the 3 strike out situation.
  • Monitor all service startup types with the exclusion of disabled services from alerting.
  • Custom discovery which discovers and adds all the service objects to one class rather than scattering them about like the templates do.

Taking the MP for a Test Drive

I've been running this MP solution in my demo and semi-production SCOM environments (both 2012 R2 and 2016) for the last couple of months with no issues and I felt it was about time to spread the word on how much effort you can save when you use it.

The first thing you'll need to do is to download the latest version of this management pack and you can get it from the TechNet Gallery here.

Next up, you'll want to get yourself a coffee (or beer, if that's how you roll) and take a read through Andy's original blog post using the link below:


Note: Everything you need to know is available in Andy's blog post and for clarity, I'll just blog my own experience on getting the MP up and running here.

When you download the zip file containing the MP, extract it to a location on a computer that runs the SCOM console and you should see the following three files...


The Readme.txt contains a note from the author highlighting the fact that this MP is still in it's early days of development and that you should always test it in a non-production environment first.

The WindowsServiceMonitor.xml file is the unsealed MP used for monitoring your Windows Services and the ServiceMPEditor.ps1 file is a clever PowerShell script that launches the UI-based editor to help you customize the MP for your own (and customer) environments.

Before we go any further, we need to import the WindowsServiceMonitor.xml file into SCOM using the Import Management Packs option from the Administration\Management Packs area in the console as shown here....


Next up, we'll create a temporary folder on the same computer that you've just used the console to import the management pack with. We'll create a folder in C:\Temp\SCOM (shown in the image below) but you can use whatever path you wish for this.


Once the folder has been created, launch a PowerShell window with administrative permissions and run the ServiceMPEditor.ps1 script to open the Service MP Editor similar to the following image...


Now, there's a specific order of steps that you need to follow when entering information into the Service Editor and for this part, I've borrowed the original numbered step-by-step image from Andy's blog post that should make things easy to understand...


If you want to add monitors for a small number of Windows Services, then follow these steps in order (we'll cover importing a larger list of services later):
  1. Management Server – type the name of one of your SCOM management servers in this field.
  2. Management Pack Location – type the location of the temporary folder that you created earlier (we'll use C:\Temp\SCOM) into this field.
  3. Get MP Config – clicking this button will export a copy of the original WindowsServiceMonitor.xml management pack from your SCOM environment into the temporary folder location specified in the previous step.
  4. New Service – a click of this button will ready the Service Name field to allow you start a new service configuration.
  5. Service Name – it's imperative that you type the exact 'Service name' of the Windows Service in here and not the 'Display Name' (refer to the example in the previous image taken from Andy's blog where he has highlighted the Service name for the Print Spooler service - which is simply named Spooler).
  6. Confirm Service Edit – clicking this after you've specified the Service name and are finished choosing all your service monitoring options.
  7. Save MP Config – click this button when you're finished editing and ready to commit your changes to the management pack.
Here's a screenshot of what the editor looks like in my demo environment where I've added three services (Windows Firewall, Windows Time and Print Spooler).


After you've clicked the Save MP Config button, you can close the editor and check that the C:\Temp\SCOM\WindowsServiceMonitor.xml management pack contains the newly added services...


Now re-import the management pack from your temporary location back into SCOM using the Import Management Packs from the console. You'll get a notification stating that the management pack is already installed and you can just ignore this and hit the Install button to re-import it again as shown here...


Once the management pack completes it's discovery, you should be able to see the newly monitored services light up in the Discovered Inventory view from the Monitoring workspace of the console (make sure to change the target for this view to WindowsService as shown below).


If you're impatient like me and don't want to wait for the discovery to kick in automatically (by default it's configured to run once a day), you can either reduce the discovery time with an override or simply bounce the Microsoft Monitoring Agent service on the server(s) running the service that you want monitored and you should then see the Discovered Inventory view populating like this...


To test the management pack, stop one of your newly monitored services and after a minute or so, you should see the service roll up as a critical state to the Windows Computer object that's hosting it as shown here in this diagram view...


The nice thing with this management pack is that it comes with some custom tasks to help you manage your monitored services and clicking the Start Service task from the pane on the left (shown below), will then restart the problematic service for you without the need to logon directly to the computer!


Note: You could also enable the automatic WindowsService.ServiceStart.Recovery task option from the Diagnostic and Recovery tab of the monitor to get SCOM to restart the service automatically itself in the event of it stopping unexpectedly. This recovery task will restart the service automatically up to 3 times before giving up and alerting you to the fact that the service is constantly being stopped and started.

Importing a Custom List of Services

If you have a large list of Windows Services that you want to monitor and don't fancy having to manually enter each one into the Service Editor, then there's a handy Import Services option that allows you to import a CSV file with the list of custom services that you want monitored.

You need to understand the format the CSV file needs to be in first however as if you get it wrong, you'll end up having to either edit the XML file directly or just start the whole process again.

Here's the steps I went through in the editor to get this bulk import option working:
  1. Management Server – type the name of one of your SCOM management servers in this field.
  2. Management Pack Location – type the location of the temporary folder that you created earlier (we'll use C:\Temp\SCOM) into this field.
  3. Get MP Config – clicking this button will export a copy of the original WindowsServiceMonitor.xml management pack from your SCOM environment into the temporary folder location specified in the previous step.
  4. Import Services –  this button is used to select a CSV file that contains a list of Windows Service names that you want to monitor. The CSV file must be named WindowsServiceMonitor.csv and needs to be located in the temporary folder location specified in the Management Pack Location field.
Here's a screenshot of the steps you need to take in the editor when you want to import a list from CSV....


When you click the Import Services button, you'll be presented with the warning below stating the name and location that your CSV file needs to have...


Assuming you've named your CSV file correctly and copied it to the temporary location specified in the warning dialog, click Yes to continue and you'll be presented with the custom list of services to be monitored as specified in the CSV you previously created.

CSV Creation Tip #1 - The  CSV file needs to be formatted with four column names (Service, Start, End, DaysofWeekMask) and you need to specify values similar to the image below...


CSV Creation Tip #2 - An easy way to quickly grab a CSV file in the correct format is to just manually add one or two Windows Services to the Service Editor and then use the Export Services button to export a template CSV file that you can edit as you need.

CSV Creation Tip #3 - You can export a full list of Windows Service names to a CSV file by using the following PowerShell command (this exported CSV file won't be in the correct format for the Service Editor so you'll need to then copy/paste the names from here into the previously created WindowsServiceMonitor.csv file):

Get-Service | Sort-Object -Property DisplayName | Export-CSV -path C:\winserviceexport.csv


When you're satisfied with the imported bulk list of Windows Services, the final step you need to complete in the editor is to hit the Save MP Config button to commit the changes to the MP.


Now all that's left to do is to close the editor and re-import the newly updated MP from your temporary location back into SCOM.

After the discovery process completes, you can see the full list of monitored services from the Discovered Inventory view similar to my demo environment here...


All credit goes to Andy Leibundgut for his contribution of this management pack to the SCOM community - and make sure to leave any comments you have on bugs or suggested improvements directly on his original blog post here.

Tuesday, April 4, 2017

Cloud and Datacenter Conference 2017

Conference season is beginning to kick off again and in just over four weeks time (4th - 5th May), I'll be presenting a session at the Cloud and Datacenter Conference in Munich.


The conference is organised by Rachfal IT Solutions and it's the brainchild of my good friend and well-known MVP Carsten Rachfal (aka @hypervserver). It's my first time presenting at this event and it'll also be my first time in Munich so I'm really looking forward to it.

There's a long list of awesome speakers presenting over the two days that reads like a who's-who of Cloud and Datacenter specialists from across the MVP and Microsoft world.

My presentation will be in the Chicago room on the Thursday and it's titled 'What's New in OpsMgr 2016?'. In the session, I'll demonstrate new features, enhancements and administration tips to help make your OpsMgr 2016 environments rock.

Here's a snippet of the agenda for the room I'll be presenting in...


You can check out the full conference schedule here.

Browsing through the schedule, there's a really good mix of sessions delivered in either German or English and I've already bookmarked a number of them to attend so I can learn from the experts in area's like Hyper-V, Azure Stack, Azure and OMS.

If you're in Germany and haven't registered yet, head over to https://www.cdc-germany.de/ and get your tickets before it sells out as from what I've heard about the venue, food, content and networking at last years event, it's going to be epic!