Wednesday, July 25, 2012

SCOM 2012 - Deploying Cumulative Update Rollup 2 (CU2) Hotfix

Here, we go again with another round of Cumulative Updates to apply to your System Center 2012 deployments. Yesterday, Microsoft announced the release of Cumulative Update 2 (UR2) for the System Center 2012 suite and you can find a description of it here.

Unlike Cumulative Update 1, this hotfix just provides resolution to five issues, three of which are on the Cross Platform/Unix/Linux side of the product.

This post will walkthrough the steps required to deploy the Update Rollup 2 to your SCOM / OpsMgr 2012 deployment. This post is effectively an update of my previous post on deploying Update Rollup 1 (CU1) to SCOM / OpsMgr 2012.

As before, the process to deploy the update is quite simple and this time there is no need to run any SQL queries against the SCOM databases as part of the update - as was the case with the SCOM 2007 R2 CU's. Some of the information below is taken directly from KB2706783 on the Microsoft Support website.


To begin, here are some known issues to be aware of when deploying this update rollup:
  • Updates do not appear in the Add or Remove Programs item in Control Panel after you install Update Rollup 2.
  • The version number of the console does not change after you install Update Rollup 2. After Update Rollup 2 is installed, the version number of the console remains 7.0.8560.0.
  • After you install Update Rollup 2 on a web console, the following error occurs in Internet Explorer:
Server Error in '/OperationsManager' Application

To resolve this issue, close and then restart Internet Explorer.

    Installation Notes
    • Operations Manager Update Rollup 2 will at first be available only in English and cannot be applied to non-English versions of System Center 2012. Non-English versions of Update Rollup 2 will be available later in 2012.
    • You must run these updates as an administrator.
    • You have to close the console before you apply the console update to avoid having to restart the computer.
    • You must restart and clear the browser cache to start a new instance of Microsoft Silverlight.
    • This update rollup should not be installed immediately after you install the server. Otherwise, you could encounter an issue in which the Health Service state remains uninitialized.
    • If User Account Control is enabled, the .msp update files must be run from an elevated Command Prompt window.
    • System Administrator rights on the database instances for the Operational Database and Data warehouse are required in order to run updates on these databases.
    As described in KB911722, the web console fixes will work after you add the following line to the %windir%\Windows\Microsoft.NET\Framework64\v2.0.50727\CONFIG web.config file:

    <machineKey validationKey="AutoGenerate,IsolateApps" decryptionKey="AutoGenerate,IsolateApps" validation="3DES" decryption="3DES"/>Note This line should be added under <system.web>

    Note: As with all updates, it goes without saying that you should first make a full backup of your SCOM 2012 environment before proceeding with these steps.

    The supported installation order of CU2 is as follows:

    Server Infrastructure Deployment Order Overview:
    • Management server or server
    • Gateway servers
    • Reporting servers
    • Web console server role computer
    • Operations console role computers

    Note: If Connected MG/Tiering is enabled, the top tier should be patched first.


    Update Management Packs Overview:
    • Manually import CU2 management packs

    Agent Deployment Overview:
    • Apply the agent update to manually installed agents, or push installation from the Pending view in the Operations console.

    Note: This update rollup can be installed on agents either before or after server infrastructure.

    Installation

    Download CU2 to a location on your SCOM 2012 Management Server from the link below:

    Update Rollup 2 for System Center 2012 Operations Manager

    Right mouse click on the downloaded package and choose 'Run As Administrator' to begin the extraction of files


    Click Yes to accept the licence


    Choose a location to extract the files to (this can be a shared network folder if needs be), then click OK twice to finish the extraction


    You should now see the following files extracted to the chosen folder


    Server Infrastructure

    Now you need to apply the relevant .MSP package to your computers depending on the architecture (AMD64 or i386) and the role each one has in your SCOM environment (Server, Console, Web Console, Reporting, Gateway or Agent)

    Note: On servers that have User Account Control (UAC) enabled, be sure to run these updates from an elevated command prompt as you will most likely receive 'Access Denied' errors when running direct from the GUI.

    The server I'm installing this to is a single SCOM (OpsMgr) 2012 Management Server with the Console and Web Console roles deployed so in this instance, I have to install three packages - KB2731874-AMD64-Server, KB2731874-AMD64-Console, KB2731874-AMD64-WebConsole.

    In my environment, I also need to deploy the KB2731874-AMD64-Reporting package to my SQL Reporting Services (SSRS) server and the KB2731874-AMD64-Gateway to my SCOM (OpsMgr) 2012 Gateway server.

    To install a package, just right mouse click on it and then choose Apply from the menu as below


    You will see a window similar to the one below open up and run through some processes before automatically closing without any notification or reference to the process being completed.


    Once you have updated your server, browse to the SCOM 2012 installation folder - normally located at C:\Program Files\System Center Operations Manager 2012\Server. Once here, add a column view for 'File Version' and then sort the column by file version and you should see four files with a new version level of 7.0.8560.1027 as the screen below shows


    If you don't see the product version updated as above to your files, then your server hasn't updated properly and you will need to revisit the installation to see if you've missed something.

    Once you are happy that your first SCOM 2012 Management Server has been updated, then you can then move onto installing the new management packs that come with the CU2 hotfix.

    Note: You only need to import the updated management packs once. You will not have to carry out this process for every SCOM server role that you upgrade.

    To do this, simply open up the SCOM Console and click on the Administration button in the wunderbar from the bottom left hand side of the screen. From there, expand the Administration view, right mouse click on Management Packs and then select Import Management Packs from the resultant menu


    From the Import Management Packs window, click on the Add button, choose the Add From Disk option and then click on No when prompted to go online to download any dependencies


    You now need to browse to the location that you expanded the CU2 file into previously and you should see three management pack files (.MP). Select all three files and click on the Open button


    If you have previously upgraded to Cumulative Update 1 (UR1), then you will notice that the version of the Data Warehouse Library management pack is the same version number for CU2 and this will not be imported. If you haven't upgraded to CU1, then the import will upgrade all three new management packs at this point.


    Click on Yes from the security warning to confirm you are happy to continue


    Once the import is completed, you should see a successful status beside either two or three management packs (as mentioned above, the number of management packs imported here depends on whether or not you've previously upgraded to CU1) confirming you have imported them without issue


    When you have upgraded the first SCOM 2012 Management Server and imported the updated management packs into your environment, you then need to repeat the .MSP installation process on all of your other SCOM 2012 server roles as well

    Agent Infrastructure

    Although the agent installation upgrade can be carried out at any time, I prefer to wait until I have upgraded my SCOM 2012 server infrastructure first before working on the agents.

    To upgrade the agents using the SCOM 2012 Console, simply browse to the Administration tab again in the wunderbar, expand the Administration view, expand Device Management and then click on the Pending Management view to see all of the agents awaiting upgrade. Highlight the ones you want to upgrade, then click on the Approve link from the Tasks pane on the right hand side to update all of your push based agents


    For any agents that have been manually installed, then you will manually need to copy the .MSP file for the agent to each server and manually carry out each upgrade.

    Unix/Linux Infrastructure

    Once you've upgraded your Windows based servers and agents, all that's left to do now is to upgrade any Unix/Linux agents that you have in your environment. The following is taken directly from KB2706783:

    Installation instructions for Operations Manager UNIX and Linux monitoring packs and agents

    To install the updated monitoring packs and agents for UNIX and Linux operating systems, follow these steps:

    • Download and then install the updated management packs from the following Microsoft website:
    System Center Monitoring Pack for UNIX and Linux Operating Systems

    • Import the updated management pack for each version of Linux or UNIX that you are monitoring in your environment.
    • Upgrade each agent to the latest version by using either the Update-SCXAgent Windows PowerShell cmdlet or the UNIX/Linux Agent Upgrade Wizard in the Administration pane of the Operations Console.

    Note:The management pack bundle files for each UNIX and Linux operating system version contain the management pack and agent files. You may have to wait several minutes after you import the management pack bundle before the agent files are available for agent upgrades.

    That completes the deployment of SCOM 2012 Cumulative Update Rollup 2 (CU2) into your environment.

    Monday, July 23, 2012

    SCOM 2012 - The APM Consoles Part 1 - Application Diagnostics

    I don't know about you, but as a System Center consultant, I really appreciate when new features give us new consoles to work with as it keeps things different during deployments and when presenting.

    With System Center 2012 Operations Manager (SCOM / OpsMgr 2012), we have the new Application Performance Monitoring (APM) feature that allows us to deep-dive into the code of our .NET applications from a server and client-side perspective. APM comes with two new web consoles that are installed together during the deployment of the SCOM 2012 Web Console role.

    These are the Application Diagnostics and Application Advisor consoles and the aim of this short blog series is to give people a much better understanding of what they can do and how you can use them when managing your applications from an APM perspective.

    If you haven't yet configured APM in your environment or still aren't too sure about exactly what it is, then check out these previous posts to get you started before reading through this series:

    SCOM 2012 - Configuring Application Performance Monitoring (APM)

    SCOM 2012 - APM CSM vs. GSM and Web Application Monitoring....Confused?

    Application Diagnostics Console Overview

    Known as SE Viewer in AVIcode 5.7, the Application Diagnostics console is used to organize and link events across your monitored .NET applications to help you quickly ascertain the root cause of a problem. It allows you to analyze the individual performance and reliability events that are being raised within your .NET application along with the transaction chains related to those events to help you to understand how these types of issues are impacting your business applications.

    This console will be of definite interest to the members of the development team as it returns a whole raft of additional information that isn't available within the standard SCOM 2012 console as shown in the screenshot below.


    Launching

    If you want to launch the Application Diagnostics console, there are several ways to do this. The easiest way is to open up a web browser and then input the URL of the Management Server that you've deployed the Web Console role to while adding /AppDiagnostics to the end of it similar to:

    http://<WebConsoleServerName>/AppDiagnostics

    Another way to launch the Application Diagnostics console is to logon to the server that you installed the Web Console to and browse to the built-in Start Menu shortcut at All Programs > Microsoft System Center 2012 > Operations Manager > Application Diagostics as shown below

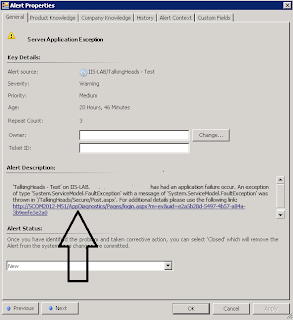
    Lastly and probably the most common way that you'll launch this console is by clicking on the scoped URL link in the Alert Description or Alert Context pane of an APM alert that is located in the Monitoring > Application Monitoring > .NET Monitoring > Active Alerts view of the Operations Manager console. The screenshot below shows an example of the scoped URL presented from within the Alert Description tab of one of these alerts.

    Security

    Regardless of the method used to open the Application Diagnostics console, you will still need to ensure that the user account you are logged in with has the relevant security permissions within SCOM to launch it. Your user account must be a member of the following roles:
    • Operations Manager Administrator Role
    • Operations Manager Application Monitoring Operator Role

    Inside the Console

    When you've launched the console, there are four navigation buttons that you can click on. Each one represents a different area that you can browse to that deliver the type of application diagnostics required to quickly find the root cause of a problem.

    These buttons are shown in the screen below


    Computers Button

     The Computers button gives you information on the computers that are hosting your .NET applications. From here, you can create and select new Application Groups that allow you to focus in on events orginating from the same applications.


    You also have the option of choosing between a Configuration view or a Resource Utilization view


    The Configuration view lists the computers that your monitored .NET applications are running on and delivers basic information about the number of CPU cores they're running and their monitored processes too.

    The Resource Utilization view also lists the computers that are running your .NET applications but returns additional information about resources such as % CPU Time, Memory, I/O and Application Load.

    If you click on the name of a computer from within either the Configuration or Resource Utilization views, you'll then be presented with a new window containing four tabs listed as follows:

    • Key Metrics - Average and peak values of the computers key metrics
    • Trend Reports - Reports on APM related performance counters over a given period
    • Monitored Processes - Details over a specified time, the process name, uptime and additional information such as PID, Framework version and application pool type
    • Monitored Applications - Overview of applications being monitored along with number of events, sessions and requests

    The screenshot below shows the four different tabs when clicking on a computer from within the Resource Utilization view


    Applications Button

    Clicking on the Applications button will give you a view very similar to the view you would see when clicking the Computers button as described above. However, this view displays information on the actual .NET applications as opposed to the computers that host them.

    Inside here, you'll see that you can still filter using scoped Application Groups if you wish however, clicking on an application from the central pane will present four slightly different tabs to work with. These tabs are:

    • Key Metrics - Display a performance graph with data from the application on its load, monitored requests and average request time.
    • Trend Reports - View trend reports on APM related performance counters over a given period
    • Computers - An overview of the computers being monitored along with the number of events, sessions and requests.
    • Topology - Overview of the basic topology of the application and gives a breakdown of where the events are happening based on chains across the server-side and client-side components.

    My personal favorite option here is the Topology tab and here you can segment alerts between the different .NET application components over a specified discovery period as shown below


    Clicking on either the server or client-side component within this Topology view, will open an Events view for your application with only the events and alerts that have been scoped for that specific application component source as seen in this screenshot


    Events Button

    Clicking on this button generally shows a large amount of alerts and events in the central pane, however, we have the option to filter event data based on criteria such as:

    • Status (New, Reviewed, Deleted and By Design)
    • Aspects  (Application Failure, Connectivity, Security and Performance)
    • Event ID
    • Description
    • User
    • Date (Any Date, From Recent Perfiod and Between Dates)
    • Location (Sources and Computers)
    • Client Data (IP and Session ID)

    In this view and from the central pane, we can see two different Sources for .NET application generated events (client-side and server-side) and these are easily identified in the Source column. When you click on an event here, the Source of the event will determine the different tab options available to you.


    The Aspect of your event will also determine the type of information returned back to you and if you want to see the well known (and often demonstrated) graphic of a client-side performance event, then click on a client-side event with an Aspect type of Performance as shown below


    Clicking on this type of event should then produce information similar to the following familiar screenshot


    Advisor Button

    Lastly, the only purpose of this button is to act as a shortcut to launch the Application Advisor console directly from inside the Application Diagnostics console. Part 2 in this series will cover Application Advisor in more detail.

    SCOM 2012 - Export List of Agent Managed Devices to CSV File

    I had a requirement today to export a list of all the SCOM / OpsMgr 2012 agent managed devices to a CSV file and thought I'd do up a quick post in case anyone else finds it useful.

    This also might come in handy as an add-in for your System Center 2012 Orchestrator runbooks too.

    All that's needed is just a single line of PowerShell as follows:

    SCOM 2012

    get-scomagent|export-csv -notype c:\scomagentdevices.csv

    SCOM 2007 R2

    get-agent|export-csv -notype c:\scomagentdevices.csv

    Just copy and paste the relevant line of script from above into PowerShell on one of your SCOM management servers to create a file on the C:\ drive called 'scomagentdevices.csv'. This CSV file contains all of the information available on the agent such as -Patchlist, PrimaryManagementServerName, ManagementGroup, ID, LastModified, Name, DisplayName, HostComputer - etc.

    You can easily scope down the criteria to be exported by simply modifying the PowerShell line above to include a property value such as just the DisplayName as below:

    SCOM 2012

    get-scomagent|select DisplayName|export-csv -notype c:\scomagentdevices.csv


    If you are presented with any errors within the Operations Manager Shell when you first open it such as:

    The term '.\OperationsManager\Functions.ps1' is not recognized as the name of a
    cmdlet, function, script file, or operable program. Check the spelling of the
    name, or if a path was included, verify that the path is correct and try again.
    At line:1 char:67
    + Import-Module OperationsManager; .\OperationsManager\Functions.ps1 <<<< ; .\O
    perationsManager\Startup.ps1
    + CategoryInfo : ObjectNotFound: (.\OperationsManager\Functions.p
    s1:String) [], CommandNotFoundException
    + FullyQualifiedErrorId : CommandNotFoundException


    Then simply type the following in before running the export line of script outlined above:

    import-module OperationsManager

    Hopefully someone else finds this helpful too!

    Monday, July 16, 2012

    Quick Reference Post - SCOM (OpsMgr) 2012 Group Maintenance Mode Script

    This post is as much a place-holder for me as it is for anyone else and something that is of utmost importance in System Center 2012 Operations Manager (SCOM / OpsMgr 2012) deployments.

    Pete Zerger and Matthew Long of Infront Consulting have put together a nice and simple (but very effective) script that enables maintenance mode of groups in SCOM 2012.

    This script has been designed to make scheduling it as a Windows Scheduled Task work seamlessly.

    Check out the magic here:

    OpsMgr 2012: Group Maintenance Mode via PowerShell (the way it should be)

    Nice one guys :)

    SCOM 2012 - APM CSM vs. GSM and Web Application Monitoring....Confused?

    Every time a new product is released, we get bombarded with loads of new acronyms to try get our heads around. Once we figure out what these acronyms mean, then we have to understand what new features they actually refer to and how (or if) we can use them in our deployments. System Center 2012 Operations Manager (SCOM /OpsMgr 2012) is no different.

    APM

    When Microsoft acquired AVIcode in 2010 and integrated it into SCOM 2012, we then had access to Application Performance Monitoring or APM straight out of the box. APM brings a new level of deep-dive monitoring and is designed to try and bridge the gap between the development and infrastructure teams responsible for your applications. A while back, I wrote a short series of blog posts on configuring APM and if you want to learn how to set it up in your environment, then check them out using the following link: SCOM 2012 - Configuring Application Performance Monitoring (APM)

    CSM

    With APM, we get two types of monitoring to work with from an application level. Server-side Monitoring and Client-Side Monitoring - also known as CSM.  CSM works with a specified application from the 'inside' and raises alerts based on the actual code. It also has a pre-requisite that APM Server-Side Monitoring is configured first and that the IIS websites hosting the web application must also be discovered and monitored too.

    The screenshot below shows an example of CSM in SCOM 2012


    From a performance perspective, CSM can tell us when there is a performance related problem with our application and then deep-dive into it 'to tell us why' there’s a problem. CSM returns real data based on the users experience of the web application.

    Web Application Monitoring

    Web Application Monitoring is another feature that comes out of the box with SCOM 2012. It works with any given web application's URL to probe the application from the 'outside' using designated watcher nodes that have the SCOM agent installed on them.This type of monitoring also provides the functionality to record web browser sessions and the screenshot below shows an example of this in action.


    To use Web Application Monitoring, there's no requirement to have APM or IIS monitoring in place first. Although this type of monitoring can certainly tell us that there's a performance issue when accessing a particular website,  it 'cannot tell us why' there is a problem. Web Application Monitoring simulates the users experience of the web application.

    Check out this post for more on Web Application Monitoring: SCOM 2012 - Recording a Web Browser Session

    GSM

    Recently, Microsoft announced the 2nd Customer Technology Preview (CTP2) release of Service Pack 1 for System Center 2012 which includes a new feature called Global Service Monitor or GSM.  GSM is a cloud based service running on Microsoft's Azure platform that extends SCOM 2012 capabilities by providing a kind of "agents in the cloud" extension to your on-premise monitoring and delivering an 'outside-in' perspective of your applications.

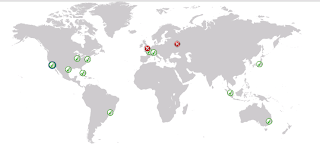
    It allows you to schedule automatic synthetic transactions from locations around the world providing the capability to monitor the availability, performance and reliability of your externally facing web applications as shown in the screenshot below. Essentially, GSM also simulates the users experience of the web application.


    Microsoft's Ã…ke Pettersson has put together a very informative blog post on configuring GSM that's well worth taking a look at here.


    Better Together

    From the information above, we can see that on the surface of it, you would be forgiven for thinking that they are all simply application monitoring features that deliver the same 'end goal'. It's understandable that some people might then presume that you don't need to deploy or use all of these features inside your SCOM 2012 environment and that one feature or the other would suffice.

    When comparing these different application monitoring features however, it’s important to be aware that it most definitely isn’t a case of choosing one over the other. On the contrary, APM CSM, GSM and Web Application Monitoring all complement each other and, although they all monitor the users experience of the web application, they use very different methods to do it.


    The best way to ensure that you get the full '360 Degree' monitoring view of your web applications is to first use APM CSM to deliver the rich in-depth code analysis that you need. Then to have it working in conjuction with GSM and Web Application Monitoring which have responsibility for probing the application websites for availability from locations all around the world and ensuring that web transactions are actually happening in the first place.

    Don't forget of course, that if you want to be able to use APM CSM to manage alerts and exceptions that are generated from within your applications, you need to have users hitting your website and using the application in the first place. If nobody can access it by URL or if the performance of it is poor from certain locations around the world, then APM CSM alone won't be able to help you!

    All things considered, it's always recommended to configure your application monitoring using a combination of all the above features to get the transparency that you need to be pro-active as opposed to re-active when it comes to resolving availability and performance issues.


    An added bonus will also be a happy joining of your Dev and Ops teams when it comes to application troubleshooting!

    Friday, July 13, 2012

    SCOM 2012 Network Monitoring - Dude, Where's My Network Device Components?

    With System Center 2012 Operations Manager (SCOM / OpsMgr 2012), we now have some excellent new Network Monitoring functionality that I've previously blogged about how to configure and described what type of discoveries where available.

    Sometimes though, when administrators or consultants deploy the SCOM 2012 Network Monitoring feature, they find that SCOM doesn't retrieve the information and discoveries on their network devices that they had initally hoped for or read about.

    Instead they find that all that get's discovered is the network interface that the device was initally discovered on and it has simply performed an availability poll to return a health status back to the console- effectively giving them just a simple "Up or Down" scenario which is pretty much the same type of network monitoring that was made available out of the box with SCOM 2007 R2.

    The screenshot below shows an example of this basic level of network monitoring


    If this scenario seems familiar to you and you are contemplating scrapping the built-in network monitoring features of SCOM 2012 and instead downloading and importing the old and reliable xSNMP Extensions MP that delivered so much in SCOM 2007 R2, then DON'T!

    First up, the xSNMP Extensions MP breaks cookdown in SCOM 2012 and won't work. All it will do is impact performance in your newly deployed SCOM 2012 environment and cause you endless headache.

    Secondly, there is a valid reason as to why you are only seeing basic availability monitoring with your network devices.

    SCOM 2012 lets you discover and monitor a large variety of different vendors network devices. It monitors any network device that supports SNMP and also provides extended monitoring for devices that implement the Management Information Base (MIB) RFC 2863 and MIB-II RFC 1213 standards.

    It's this extended monitoring that delivers the deep level discoveries and performance data that you are looking for.

    Microsoft have published an Excel spreadsheet with a list of over 800 network devices that support the extended monitoring capability of SCOM 2012. The information in the list is based on OID, device type, vendor, model name, and whether or not the processor and memory are monitored as part of the extended monitoring function.

    The Excel spreadsheet list can be downloaded from here:

    http://www.microsoft.com/en-us/download/details.aspx?displaylang=en&id=26831

    From the spreadsheet (see screenshot below) you can see what level of network monitoring you can expect from your device.


    The level of information that you are going to see is dependent on the MIB that Microsoft has used in the discovery. If your device is on the list then it will be “Certified” and this means that some level of detailed monitoring will take place that can include information on Processor, Memory and Chassis.

    The screen below shows an example of a Certified network device in SCOM


    If your network device is not on the Excel spreadsheet then it will be discovered in SCOM as a “Generic” network device, and it's this type of basic monitoring that you would have encountered in the first place.

    A quick way to see what type of monitoring is available for your already discovered network devices in SCOM is to simply click on the Monitoring tab within the Operations Manager console, then browse to the Network Monitoring folder and click on the Network Devices view.

    Once here, click on the Personalize View link from the Tasks pane on the right-hand side of the screen and in the Columns To Display section, choose the Certification check box then click OK


    This view will then show you the type of certification that your network device holds as shown below

    Hopefully this post has now given you an understanding of the different certification types and the associated diagram views they can produce for your network devices.

    Thursday, July 12, 2012

    SCOM 2012 Network Monitoring - Explicit or Recursive Discoveries?

    In System Center 2012 Operations Manager (SCOM / OpsMgr 2012), the Network Monitoring feature has been taken to another level when we compare it to it's predecessor SCOM 2007 R2. A while back, I wrote a blog post explaining the steps required to get up and running with SCOM 2012 Network Monitoring and it's a good starting point if you're looking to explore this new feature. Check out the original post here:

    SCOM 2012 - Network Monitoring Magic!

    In the steps outlined in that post, when setting up your network monitoring, you have the option to choose from two types of network discovery rules - Explicit and Recursive. The screenshot below shows the option for selecting either of these two rules


    Since April, I've been responsible for a LOT of SCOM 2012 deployments for our customers and often get asked to explain the difference between these two network discovery options. This post will aim to give you a better insight into each of them and will offer some advice on when to use each one.

    In SCOM 2012, when configuring your network monitoring, you need to create a discovery rule on a Management Server that will run the network discovery either on an automatic schedule or manual on-demand basis. A discovery rule has some restrictions so to speak though:

    • Only one discovery rule can be configured per Management Server.
    • A discovery rule can only perform one or the other of an explicit or recursive discovery and cannot perform a combination of them.
    With these points in mind, let's explain what each discovery does:

    Explicit Discovery

    This type of discovery rule is similar to what we had to work with in SCOM 2007 and it only attempts to discover devices that you have explicitly specified in the wizard by their IP address or FQDN.

    Unlike SCOM 2007 though, if you have a large number of network devices that you want to explicitly add all at once, then instead of having to do them one by one or by network subnet (familiar anyone?), you now have the option to specify a text (*.txt) file with a list of all the device names or IP addresses that can be imported into SCOM.  This is a massive time saver and a welcome addition to the discovery process.

    Recursive Discovery

    This discovery is completely new to SCOM and is a 'party piece' of the EMC Smarts (Ionix) technology that forms the basis for network monitoring in the 2012 release.

    When you select this discovery option and work through the wizard, you will come to the exact same 'Specify Devices' dialog box (shown in the screenshot below) that you would have encountered when configuring an Explicit discovery and this can initially be a little confusing.


    Recursive discovery functions by performing a network scan and attempting to initially discover devices that you have explicitly specified in the above dialog box. Similar to the Explicit discovery rule, Recursive discovery can also be configured to discover and access devices using ICMP, SNMP or both. You could also use an IPv6 addresses however; the initial device that is discovered must use an IPv4 address.That's where the comparison with Explicit discovery ends though.

    Recursive discovery will then try to discover any other network devices it knows about through its Address Routing Protocol (ARP) table, its IP address table, or the topology Management Information Block (MIB) to grow the network map and present all applicable devices to you for monitoring.

    You can also filter out devices that you don't want to be discovered by using properties such as the device type, name, and object identifier (OID). This is a handy option if you wanted to quickly discover all the network devices in your network except, a small number or some with a specific criteria.

    In really large networks with a lot of network devices, keep in mind that there is a default limit of 1500 network devices that can be discovered recursively. You can of course tweak this limit to suit your environment if you wish, but for most people, this won't be needed.

    Great, but which is the best discovery rule to use?

    This is a tough question as every network environment is different and there's no right or wrong answer here.

    Explicit Discovery Pro's

    I find that using the Explicit discovery option is the easiest way to control what gets monitored while carrying out new SCOM deployments. It's most likely that you will already know all of the network devices that you will want to have discovered if it's your own network, or if you're out on a customer site deploying SCOM, then the customer will have handed you a list of network devices to start monitoring. This method is useful also for controlling alerts and ensuring that your tuning and noise reduction process is confined to a certain number of network devices initally.

    Explicit Discovery Con's

    You need to have a list of all of the network devices that you want to monitor with SCOM 2012 and this can be cumbersome trying to put together or a lot of the time, if you arrive onsite with a customer to configure this, they might not have an up-to-date list of their devices and there's always a chance that you've missed something important.

    Recursive Discovery Pro's

    The Recursive discovery is definitely the 'sexier' of the two rules and you'll get a buzz from seeing all of the network devices getting discovered automatically in a relatively short space of time with very little input from you required. If you don't have a list of all the network devices on your network, then use this option to probe the ARP cache and discover everything for you.
    You can also create a schedule to run your recursive discovery rule a number of times a day/week/month etc. and for this reason it's very useful if you have a high turnover of network devices spread across your environment.

    Recursive Discovery Con's

    The downside to Recursive discovery scheduling though is that, it can put unnecessary load on your management servers in large network environments by discovering devices that ordinarily you have no requirement to monitor and manage. It's also not recommended to run this more than twice a week in large environments that don't have a high turnover of network devices.

    Conclusion

    So that's it! Hopefully this post has gone some way to helping you understand what the difference is between the Explicit and Recursive discovery rules in SCOM 2012. If you want to learn more about SCOM 2012 Network Monitoring and the difference between Certified and Generic devices, take a look at this post:

    SCOM 2012 Network Monitoring - Dude, Where's My Network Device Components?